Estimated Value: $374,981 - $409,000
4
Beds
2
Baths
1,189
Sq Ft
$327/Sq Ft
Est. Value
About This Home
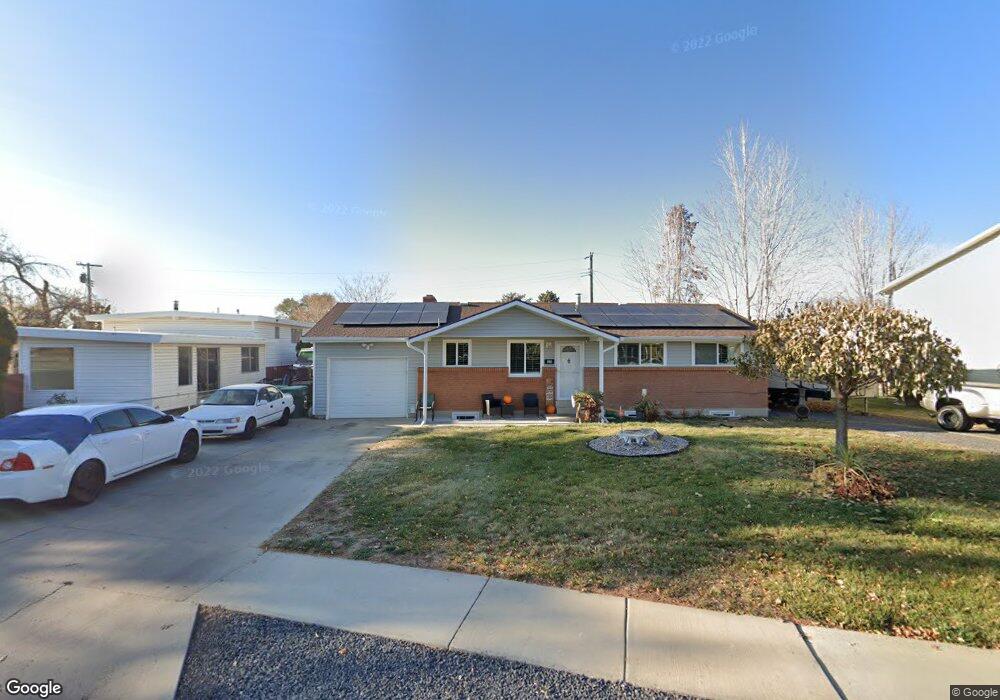
This home is located at 4859 S 2350 W, Roy, UT 84067 and is currently estimated at $389,245, approximately $327 per square foot. 4859 S 2350 W is a home located in Weber County with nearby schools including Lakeview Elementary School, Roy Junior High School, and Roy High School.
Ownership History
Date
Name
Owned For
Owner Type
Purchase Details
Closed on
Jan 29, 2003
Sold by
Bravo Emiliano
Bought by
Bravo Emiliano and Bravo Betty Joann
Current Estimated Value
Purchase Details
Closed on
Mar 29, 2001
Sold by
Goff Bruce M and Hess Ronna L
Bought by
Goff Bruce M
Home Financials for this Owner
Home Financials are based on the most recent Mortgage that was taken out on this home.
Original Mortgage
$109,058
Outstanding Balance
$40,712
Interest Rate
7.19%
Mortgage Type
FHA
Estimated Equity
$348,533
Purchase Details
Closed on
Jan 16, 2001
Sold by
Goff Bruce M
Bought by
Goff Bruce M and Hess Ronna L
Home Financials for this Owner
Home Financials are based on the most recent Mortgage that was taken out on this home.
Original Mortgage
$75,000
Interest Rate
7.54%
Purchase Details
Closed on
Aug 3, 2000
Sold by
Goff Bruce M and Goff Deborah M
Bought by
Goff Bruce M and Hess Ronna L
Purchase Details
Closed on
Apr 27, 2000
Sold by
Goff Deborah M
Bought by
Goff Bruce M and Goff Deborah M
Create a Home Valuation Report for This Property
The Home Valuation Report is an in-depth analysis detailing your home's value as well as a comparison with similar homes in the area
Home Values in the Area
Average Home Value in this Area
Purchase History
| Date | Buyer | Sale Price | Title Company |
|---|---|---|---|
| Bravo Emiliano | -- | Inwest Title | |
| Goff Bruce M | -- | Associated Title | |
| Bravo Emiliano | -- | Associated Title | |
| Goff Bruce M | -- | Associated Title | |
| Goff Bruce M | -- | Associated Title | |
| Goff Bruce M | -- | -- | |
| Goff Bruce M | -- | Associated Title |
Source: Public Records
Mortgage History
| Date | Status | Borrower | Loan Amount |
|---|---|---|---|
| Open | Bravo Emiliano | $109,058 | |
| Previous Owner | Goff Bruce M | $75,000 |
Source: Public Records
Tax History
| Year | Tax Paid | Tax Assessment Tax Assessment Total Assessment is a certain percentage of the fair market value that is determined by local assessors to be the total taxable value of land and additions on the property. | Land | Improvement |
|---|---|---|---|---|
| 2025 | $2,384 | $373,761 | $121,338 | $252,423 |
| 2024 | $2,268 | $196,349 | $66,736 | $129,613 |
| 2023 | $2,307 | $201,301 | $63,707 | $137,594 |
| 2022 | $2,550 | $231,550 | $58,207 | $173,343 |
| 2021 | $1,943 | $287,000 | $70,585 | $216,415 |
| 2020 | $1,795 | $243,000 | $70,585 | $172,415 |
| 2019 | $1,785 | $228,000 | $40,517 | $187,483 |
| 2018 | $1,618 | $193,000 | $37,469 | $155,531 |
| 2017 | $1,509 | $168,000 | $37,469 | $130,531 |
| 2016 | $1,441 | $86,068 | $19,164 | $66,904 |
| 2015 | $1,308 | $79,441 | $19,164 | $60,277 |
| 2014 | $1,312 | $78,970 | $16,299 | $62,671 |
Source: Public Records
Map
Nearby Homes
Your Personal Tour Guide
Ask me questions while you tour the home.