Estimated Value: $444,000 - $482,000
4
Beds
3
Baths
2,187
Sq Ft
$212/Sq Ft
Est. Value
About This Home
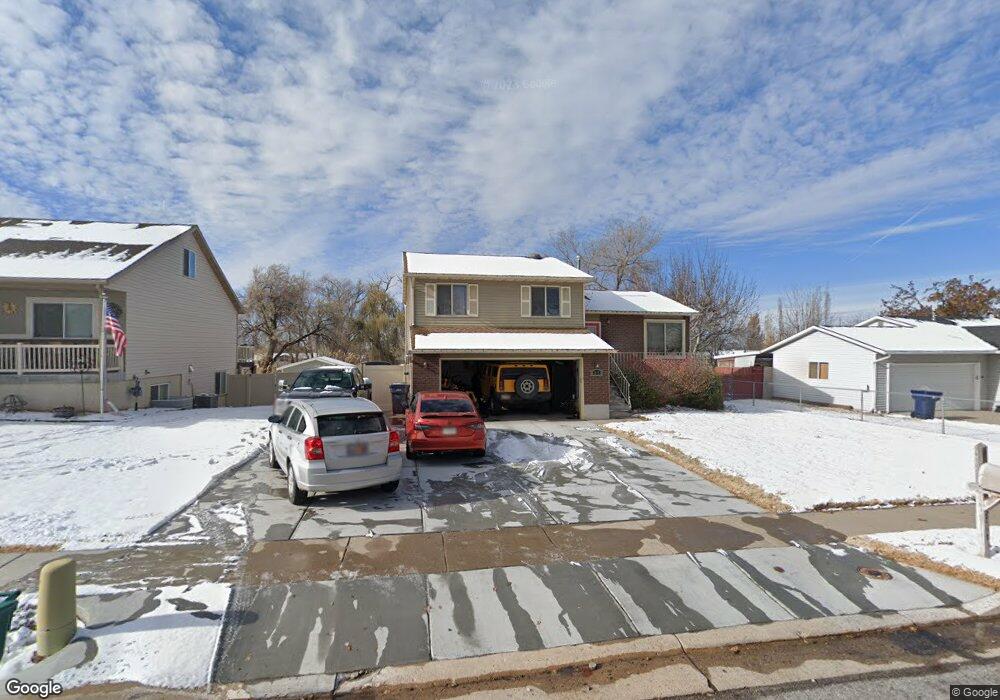
This home is located at 4859 S 3050 W, Roy, UT 84067 and is currently estimated at $462,664, approximately $211 per square foot. 4859 S 3050 W is a home located in Weber County with nearby schools including Midland School, Sand Ridge Junior High School, and Roy High School.
Ownership History
Date
Name
Owned For
Owner Type
Purchase Details
Closed on
Sep 10, 2009
Sold by
Hislop Chris C and Hislop Sallie L
Bought by
Scherick Travis John
Current Estimated Value
Purchase Details
Closed on
Jan 30, 2004
Sold by
Hislop Chris C
Bought by
Hislop Chris C
Home Financials for this Owner
Home Financials are based on the most recent Mortgage that was taken out on this home.
Original Mortgage
$110,400
Interest Rate
5.8%
Mortgage Type
New Conventional
Purchase Details
Closed on
Oct 22, 2002
Sold by
Hislop Chris
Bought by
Hislop Chris
Home Financials for this Owner
Home Financials are based on the most recent Mortgage that was taken out on this home.
Original Mortgage
$113,324
Interest Rate
6.09%
Mortgage Type
FHA
Purchase Details
Closed on
Apr 18, 2002
Sold by
Long Beach Mtg Company
Bought by
Hislop Chris
Purchase Details
Closed on
Apr 12, 2002
Sold by
Option One Mtg Corp
Bought by
Long Beach Mtg Company
Purchase Details
Closed on
Apr 4, 2002
Sold by
Hislop Chris
Bought by
Hislop Chris
Purchase Details
Closed on
Apr 5, 2001
Sold by
Walker Robert J and Residential Mtg & Investment I
Bought by
Option One Mtg Corp
Purchase Details
Closed on
Dec 7, 1999
Sold by
Walker Robert J
Bought by
Walker Robert J
Home Financials for this Owner
Home Financials are based on the most recent Mortgage that was taken out on this home.
Original Mortgage
$94,500
Interest Rate
11.45%
Create a Home Valuation Report for This Property
The Home Valuation Report is an in-depth analysis detailing your home's value as well as a comparison with similar homes in the area
Home Values in the Area
Average Home Value in this Area
Purchase History
| Date | Buyer | Sale Price | Title Company |
|---|---|---|---|
| Scherick Travis John | -- | Backman Ntp | |
| Hislop Chris C | -- | Founders Title | |
| Hislop Chris C | -- | Founders Title | |
| Hislop Chris | -- | Us Title | |
| Hislop Chris | -- | Us Title | |
| Hislop Chris | -- | Associated Title | |
| Long Beach Mtg Company | -- | Associated Title | |
| Hislop Chris | -- | Associated Title | |
| Option One Mtg Corp | $106,990 | Backman Stewart Title | |
| Walker Robert J | -- | Security Title | |
| Walker Robert J | -- | Security Title Co |
Source: Public Records
Mortgage History
| Date | Status | Borrower | Loan Amount |
|---|---|---|---|
| Previous Owner | Hislop Chris C | $110,400 | |
| Previous Owner | Hislop Chris | $113,324 | |
| Previous Owner | Walker Robert J | $94,500 | |
| Closed | Hislop Chris C | $17,000 |
Source: Public Records
Tax History
| Year | Tax Paid | Tax Assessment Tax Assessment Total Assessment is a certain percentage of the fair market value that is determined by local assessors to be the total taxable value of land and additions on the property. | Land | Improvement |
|---|---|---|---|---|
| 2025 | $2,774 | $442,651 | $130,015 | $312,636 |
| 2024 | $2,656 | $234,299 | $71,508 | $162,791 |
| 2023 | $2,498 | $220,000 | $65,864 | $154,136 |
| 2022 | $2,705 | $246,950 | $55,008 | $191,942 |
| 2021 | $2,131 | $318,000 | $75,002 | $242,998 |
| 2020 | $2,013 | $276,000 | $75,002 | $200,998 |
| 2019 | $1,932 | $249,000 | $44,989 | $204,011 |
| 2018 | $1,840 | $223,000 | $44,989 | $178,011 |
| 2017 | $1,682 | $190,000 | $44,989 | $145,011 |
| 2016 | $1,656 | $100,826 | $21,944 | $78,882 |
| 2015 | $1,436 | $88,522 | $21,944 | $66,578 |
| 2014 | $1,380 | $83,719 | $21,944 | $61,775 |
Source: Public Records
Map
Nearby Homes
- 4793 S 3025 W
- 4891 S 2875 W
- 5009 S 2925 W
- 3022 W 4750 S
- 5141 S 2975 W
- 5063 S 2825 W
- 2817 W 5000 S
- 2953 W 4650 S
- 5155 S 3200 W
- 4732 S West Park Dr
- 5304 S 3100 W
- 5321 S 3100 W
- 4510 Stone Creek Rd Unit F
- 3509 W 4835 S Unit 26
- 2581 W 5000 S
- 3517 W 4835 S Unit 27
- 3443 W 5200 S Unit 2&3
- 4491 Haven Creek Rd Unit A
- 3405 W 4525 S
- 5125 S 2600 W
Your Personal Tour Guide
Ask me questions while you tour the home.