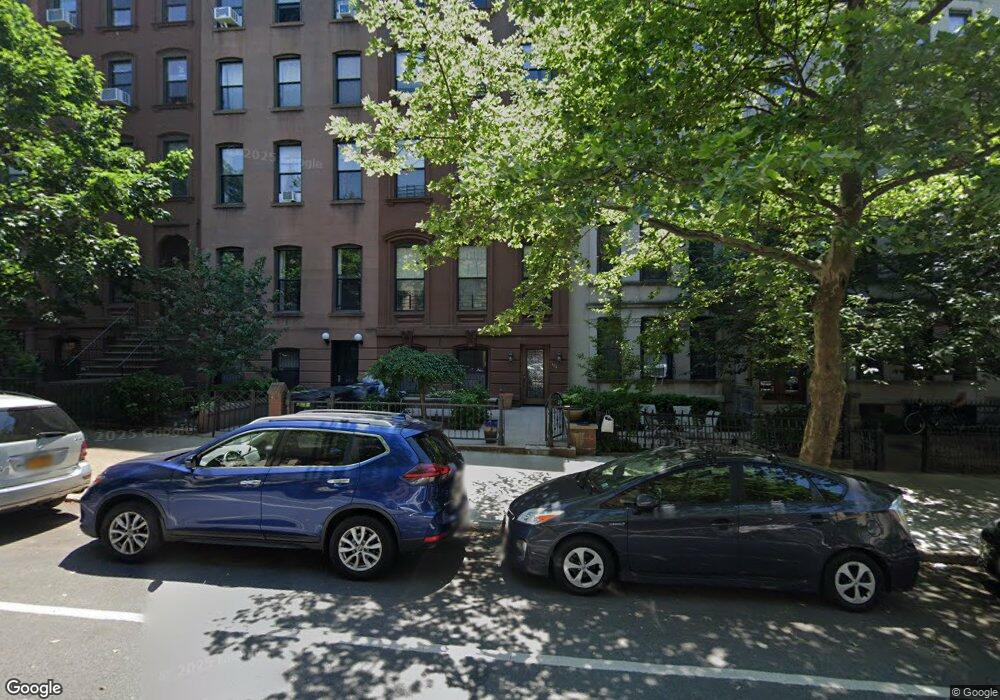
486 3rd St Unit 1DUP Brooklyn, NY 11215
Park Slope NeighborhoodEstimated Value: $2,116,000 - $2,284,000
--
Bed
--
Bath
1,446
Sq Ft
$1,497/Sq Ft
Est. Value
About This Home
This home is located at 486 3rd St Unit 1DUP, Brooklyn, NY 11215 and is currently estimated at $2,164,978, approximately $1,497 per square foot. 486 3rd St Unit 1DUP is a home located in Kings County with nearby schools including P.S. 321 William Penn, Berkeley Carroll Elementary School, and St Saviour High School.
Ownership History
Date
Name
Owned For
Owner Type
Purchase Details
Closed on
Oct 4, 2018
Sold by
Mahoney Michelle and Salkind Fred
Bought by
Evans Joshua D and Quinn Lauren
Current Estimated Value
Home Financials for this Owner
Home Financials are based on the most recent Mortgage that was taken out on this home.
Original Mortgage
$1,359,200
Outstanding Balance
$1,185,303
Interest Rate
4.5%
Mortgage Type
Purchase Money Mortgage
Estimated Equity
$979,675
Purchase Details
Closed on
May 17, 2016
Sold by
Pashkoff Steven and Squires Christine
Bought by
Mahoney Michelle and Salkind Fred
Purchase Details
Closed on
Aug 31, 2007
Sold by
Jja486llc
Bought by
Pashkoff Steven and Squires Christine
Home Financials for this Owner
Home Financials are based on the most recent Mortgage that was taken out on this home.
Original Mortgage
$840,000
Interest Rate
6.7%
Mortgage Type
Purchase Money Mortgage
Create a Home Valuation Report for This Property
The Home Valuation Report is an in-depth analysis detailing your home's value as well as a comparison with similar homes in the area
Home Values in the Area
Average Home Value in this Area
Purchase History
| Date | Buyer | Sale Price | Title Company |
|---|---|---|---|
| Evans Joshua D | $1,699,000 | -- | |
| Mahoney Michelle | $1,600,000 | -- | |
| Pashkoff Steven | $1,080,000 | -- | |
| Pashkoff Steven | $1,080,000 | -- |
Source: Public Records
Mortgage History
| Date | Status | Borrower | Loan Amount |
|---|---|---|---|
| Open | Evans Joshua D | $1,359,200 | |
| Previous Owner | Pashkoff Steven | $840,000 |
Source: Public Records
Tax History Compared to Growth
Tax History
| Year | Tax Paid | Tax Assessment Tax Assessment Total Assessment is a certain percentage of the fair market value that is determined by local assessors to be the total taxable value of land and additions on the property. | Land | Improvement |
|---|---|---|---|---|
| 2025 | $7,495 | $313,761 | $8,215 | $305,546 |
| 2024 | $7,495 | $392,228 | $8,215 | $384,013 |
| 2023 | $4,328 | $335,774 | $8,215 | $327,559 |
| 2022 | $2,099 | $329,981 | $8,215 | $321,766 |
| 2021 | $1,249 | $315,867 | $8,215 | $307,652 |
| 2020 | $937 | $255,559 | $8,215 | $247,344 |
| 2019 | $0 | $255,559 | $8,215 | $247,344 |
| 2018 | $452 | $46,117 | $1,779 | $44,338 |
| 2017 | $471 | $44,687 | $2,003 | $42,684 |
| 2016 | $463 | $41,377 | $2,036 | $39,341 |
| 2015 | -- | $38,313 | $2,124 | $36,189 |
| 2014 | -- | $35,475 | $1,670 | $33,805 |
Source: Public Records
Map
Nearby Homes
- 438 4th St Unit 3A
- 422 4th St
- 470 2nd St Unit 2
- 445 5th Ave Unit 28E
- 445 5th Ave Unit 27-28B
- 445 5th Ave Unit 24F
- 394 4th St
- 524 3rd St
- 393 4th St Unit 2
- 442 3rd St Unit 4
- 442 3rd St Unit 1
- 464 5th St
- 433 3rd St Unit 2
- 313 6th Ave Unit 2
- 539 3rd St
- 295 6th Ave Unit 3
- 291 6th Ave Unit 3
- 291 6th Ave Unit 1
- 291 6th Ave Unit 2
- 350 6th Ave Unit 4
- 486 3rd St Unit 5DUP
- 486 3rd St Unit 4
- 486 3rd St Unit 3
- 486 3rd St Unit 2
- 486 3rd St
- 486 3rd St Unit 1
- 486 3rd St Unit 5
- 488 3rd St Unit 10
- 488 3rd St Unit 1
- 488 3rd St Unit 4A
- 488 3rd St Unit 5B
- 488 3rd St Unit 1A
- 488 3rd St Unit 4B
- 488 3rd St Unit 1B
- 488 3rd St Unit 3A
- 488 3rd St Unit 2
- 488 3rd St Unit 3B
- 478 3rd St Unit 8
- 478 3rd St Unit 2L
- 478 3rd St Unit 3R