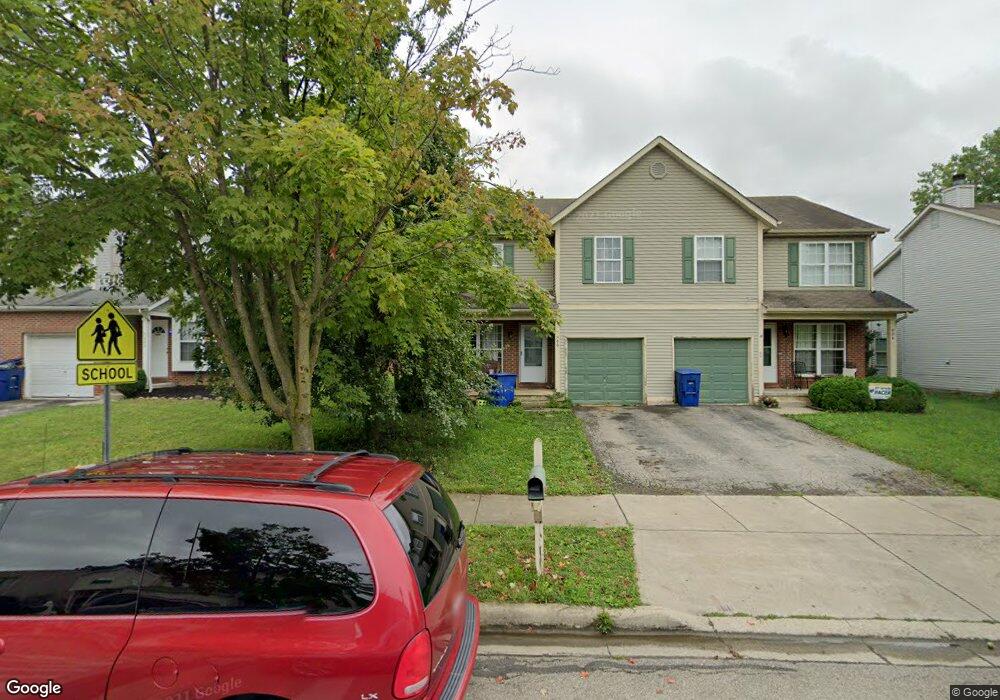
486 Applegate Ln Delaware, OH 43015
Estimated Value: $216,000 - $270,000
3
Beds
3
Baths
1,523
Sq Ft
$157/Sq Ft
Est. Value
About This Home
This home is located at 486 Applegate Ln, Delaware, OH 43015 and is currently estimated at $239,414, approximately $157 per square foot. 486 Applegate Ln is a home located in Delaware County with nearby schools including Robert F. Schultz Elementary School, John C. Dempsey Middle School, and Rutherford B. Hayes High School.
Ownership History
Date
Name
Owned For
Owner Type
Purchase Details
Closed on
Nov 3, 2021
Sold by
Reynolds Norman L and Reynolds Elaine M
Bought by
The Reynolds Group Llc
Current Estimated Value
Purchase Details
Closed on
Aug 27, 2021
Sold by
Ruri Enterprises Llc
Bought by
Reynolds Norman L and Reynolds Elaine M
Home Financials for this Owner
Home Financials are based on the most recent Mortgage that was taken out on this home.
Original Mortgage
$113,750
Outstanding Balance
$103,350
Interest Rate
2.7%
Mortgage Type
New Conventional
Estimated Equity
$136,064
Purchase Details
Closed on
Aug 17, 2006
Sold by
Gupta Ram Prakash and Gupta Usha Rani
Bought by
Ruri Enterprises Llc
Purchase Details
Closed on
Sep 16, 1999
Sold by
P & D Builders Inc
Bought by
Dillon Richard E
Create a Home Valuation Report for This Property
The Home Valuation Report is an in-depth analysis detailing your home's value as well as a comparison with similar homes in the area
Home Values in the Area
Average Home Value in this Area
Purchase History
| Date | Buyer | Sale Price | Title Company |
|---|---|---|---|
| The Reynolds Group Llc | -- | None Available | |
| Reynolds Norman L | $162,500 | Valley Title & Escrow | |
| Reynolds Norman L | $162,500 | Lawyers Title | |
| Ruri Enterprises Llc | -- | Attorney | |
| Dillon Richard E | $30,000 | -- |
Source: Public Records
Mortgage History
| Date | Status | Borrower | Loan Amount |
|---|---|---|---|
| Open | Reynolds Norman L | $113,750 | |
| Closed | Reynolds Norman L | $113,750 |
Source: Public Records
Tax History
| Year | Tax Paid | Tax Assessment Tax Assessment Total Assessment is a certain percentage of the fair market value that is determined by local assessors to be the total taxable value of land and additions on the property. | Land | Improvement |
|---|---|---|---|---|
| 2024 | $3,242 | $67,000 | $9,630 | $57,370 |
| 2023 | $3,248 | $67,000 | $9,630 | $57,370 |
| 2022 | $2,501 | $44,800 | $8,750 | $36,050 |
| 2021 | $2,556 | $44,800 | $8,750 | $36,050 |
| 2020 | $2,587 | $44,800 | $8,750 | $36,050 |
| 2019 | $2,444 | $38,360 | $7,000 | $31,360 |
| 2018 | $2,478 | $38,360 | $7,000 | $31,360 |
| 2017 | $2,320 | $36,720 | $6,160 | $30,560 |
| 2016 | $2,172 | $36,720 | $6,160 | $30,560 |
| 2015 | $2,185 | $36,720 | $6,160 | $30,560 |
| 2014 | $2,219 | $36,720 | $6,160 | $30,560 |
| 2013 | $2,232 | $36,720 | $6,160 | $30,560 |
Source: Public Records
Map
Nearby Homes
- 238 Richards Dr
- 90 Richards Dr
- 181 Delaware Dr
- 100 Gold Dust Ct
- 112 Silverline Dr
- 351 W William St
- 440 Steeplechase St
- 102 Troy Rd
- 297 W William St
- 100 Quarry Ct
- 865 Canal St
- 1016 Boulder Dr
- 103 Oak Hill Ave
- 517 Pagoda Loop
- 80 Bridgeport Way
- 345 Lenell Loop
- 370 Little Creek Dr Unit 370
- 195 Lenell Loop
- 69 Greenhedge Cir Unit 69
- 27 Woodland Ave
- 484 Applegate Ln
- 488 Applegate Ln
- 482 Applegate Ln
- 490 Applegate Ln
- 480 Applegate Ln
- 262 Richards Cir
- 492 Applegate Ln
- 260 Richards Cir
- 264 Richard Cir
- 264 Richards Cir
- 256 Richards Cir
- 266 Richards Cir
- 478 Applegate Ln
- 258 Richards Cir
- 494 Applegate Ln
- 485 Applegate Ln
- 483 Applegate Ln
- 268 Richards Cir
- 481 Applegate Ln
- 476 Applegate Ln
Your Personal Tour Guide
Ask me questions while you tour the home.