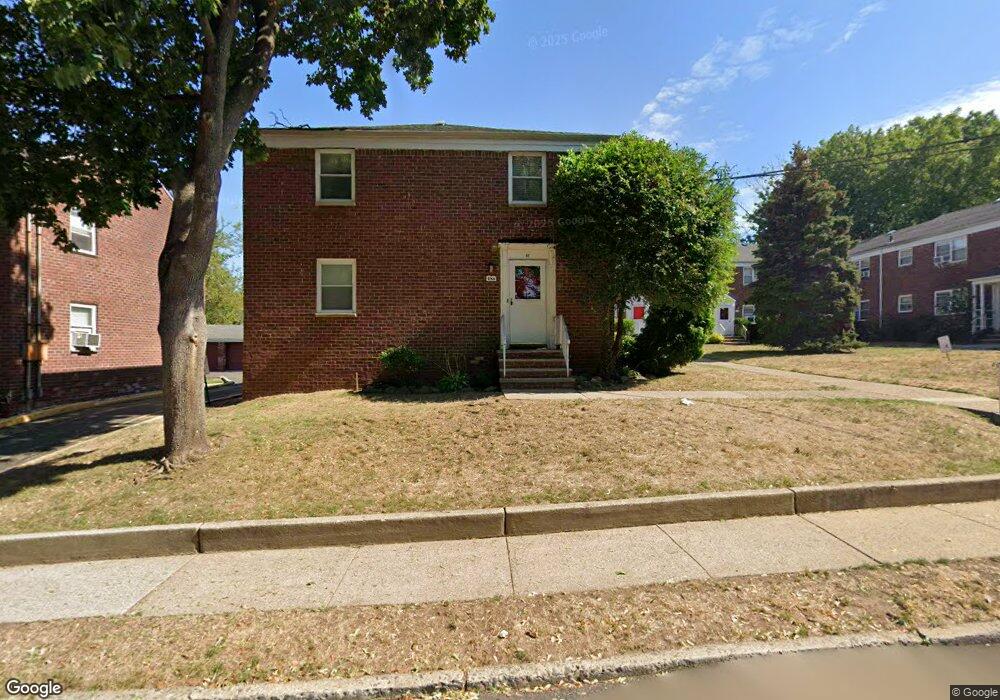
486 Blanchard Terrace Unit C0073 Hackensack, NJ 07601
Estimated Value: $276,000 - $422,000
--
Bed
--
Bath
634
Sq Ft
$517/Sq Ft
Est. Value
About This Home
This home is located at 486 Blanchard Terrace Unit C0073, Hackensack, NJ 07601 and is currently estimated at $327,769, approximately $516 per square foot. 486 Blanchard Terrace Unit C0073 is a home located in Bergen County with nearby schools including Hackensack High School and Bergen County Christian Academy.
Ownership History
Date
Name
Owned For
Owner Type
Purchase Details
Closed on
Feb 28, 2014
Sold by
Santos Rosa
Bought by
Harris Teresa
Current Estimated Value
Home Financials for this Owner
Home Financials are based on the most recent Mortgage that was taken out on this home.
Original Mortgage
$147,105
Outstanding Balance
$111,118
Interest Rate
4.25%
Mortgage Type
FHA
Estimated Equity
$216,651
Purchase Details
Closed on
Dec 7, 2009
Sold by
Hurley Jan
Bought by
Santos Rosa
Home Financials for this Owner
Home Financials are based on the most recent Mortgage that was taken out on this home.
Original Mortgage
$168,852
Interest Rate
5%
Mortgage Type
Purchase Money Mortgage
Purchase Details
Closed on
Mar 12, 1999
Sold by
Schmitt Diane L and Montecchi Linda
Bought by
Milman Irving and Milman Patricia E
Purchase Details
Closed on
Aug 20, 1993
Sold by
Johnsrud David M and Johnsrud Betsy P
Bought by
Schmitt Diane L and Montecchi Linda
Create a Home Valuation Report for This Property
The Home Valuation Report is an in-depth analysis detailing your home's value as well as a comparison with similar homes in the area
Home Values in the Area
Average Home Value in this Area
Purchase History
| Date | Buyer | Sale Price | Title Company |
|---|---|---|---|
| Harris Teresa | $150,000 | -- | |
| Santos Rosa | $178,000 | -- | |
| Milman Irving | $61,000 | -- | |
| Schmitt Diane L | $59,000 | -- |
Source: Public Records
Mortgage History
| Date | Status | Borrower | Loan Amount |
|---|---|---|---|
| Open | Harris Teresa | $147,105 | |
| Previous Owner | Santos Rosa | $168,852 |
Source: Public Records
Tax History Compared to Growth
Tax History
| Year | Tax Paid | Tax Assessment Tax Assessment Total Assessment is a certain percentage of the fair market value that is determined by local assessors to be the total taxable value of land and additions on the property. | Land | Improvement |
|---|---|---|---|---|
| 2025 | $5,864 | $191,900 | $105,000 | $86,900 |
| 2024 | $5,525 | $191,900 | $105,000 | $86,900 |
| 2023 | $5,114 | $191,900 | $105,000 | $86,900 |
| 2022 | $5,114 | $182,500 | $100,000 | $82,500 |
| 2021 | $5,155 | $153,500 | $88,000 | $65,500 |
| 2020 | $5,079 | $153,500 | $88,000 | $65,500 |
| 2019 | $4,978 | $148,300 | $86,000 | $62,300 |
| 2018 | $4,720 | $138,300 | $86,500 | $51,800 |
| 2017 | $4,655 | $136,300 | $85,000 | $51,300 |
| 2016 | $4,584 | $135,700 | $85,000 | $50,700 |
| 2015 | $4,974 | $142,100 | $56,500 | $85,600 |
| 2014 | $4,721 | $142,100 | $56,500 | $85,600 |
Source: Public Records
Map
Nearby Homes
- 486 Blanchard Terrace Unit 70
- 471 Crestwood Ave Unit 49
- 461 Heath Place Unit 23
- 137 Hartwich St
- 403 Summit Ave
- 420 Passaic St Unit 2G
- 307 Prospect Ave Unit 16A
- 307 Prospect Ave Unit 9a
- 277 Prospect Ave Unit 10B
- 277 Prospect Ave Unit h
- 277 Prospect Ave Unit 11H
- 409 W Anderson St
- 344 Prospect Ave Unit 4C
- 316 Prospect Ave Unit 3C
- 316 Prospect Ave Unit 8D
- 245 Prospect Ave Unit 5B
- 245 Prospect Ave Unit PHB
- 326 Prospect Ave Unit 6J
- 326 Prospect Ave Unit 1A
- 357 Maywood Ave
- 486 Blanchard Terrace
- 486 Blanchard Terrace
- 486 Blanchard Terrace
- 486 Blanchard Terrace Unit C0076
- 486 Blanchard Terrace
- 486 Blanchard Terrace
- 486 Blanchard Terrace
- 486 Blanchard Terrace
- 486 Blanchard Terrace Unit 82
- 486 Blanchard Terrace
- 486 Blanchard Terrace
- 486 Blanchard Terrace
- 486 Blanchard Terrace
- 486 Blanchard Terrace
- 486 Blanchard Terrace
- 486 Blanchard Terrace
- 486 Blanchard Terrace Unit 72
- 486 Blanchard Terrace Unit 67
- 486 Blanchard Terrace Unit 80
- 486 Blanchard Terrace Unit 75