486 Langford Ct Columbus, OH 43230
Estimated Value: $393,000 - $418,000
3
Beds
3
Baths
1,923
Sq Ft
$211/Sq Ft
Est. Value
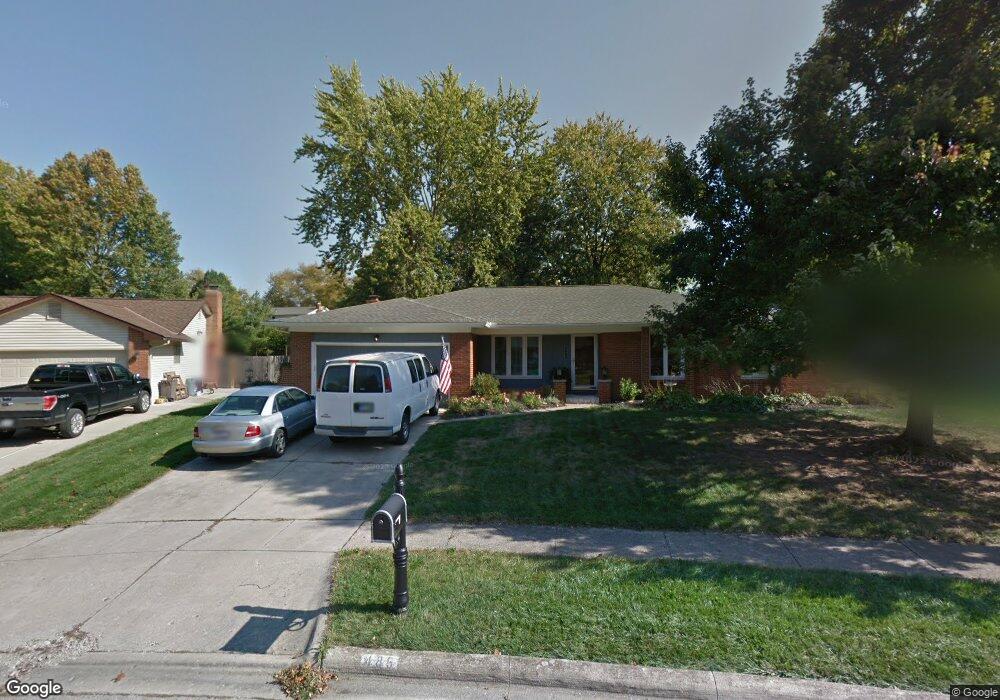
About This Home
This home is located at 486 Langford Ct, Columbus, OH 43230 and is currently estimated at $405,317, approximately $210 per square foot. 486 Langford Ct is a home located in Franklin County with nearby schools including Jefferson Elementary School, Gahanna East Middle School, and Lincoln High School.
Ownership History
Date
Name
Owned For
Owner Type
Purchase Details
Closed on
Nov 16, 2011
Sold by
Elswick Dolly M and Estate Of Maxine K Houck
Bought by
Gay Melody
Current Estimated Value
Purchase Details
Closed on
Oct 4, 2006
Sold by
Evans Carl A and Evans Lena M
Bought by
Houck Willis G and Houck Maxine K
Purchase Details
Closed on
Apr 24, 2003
Sold by
Evans Carl A and Evans Lena M
Bought by
Evans Carl A and Evans Lena M
Purchase Details
Closed on
Mar 5, 1971
Bought by
Evans Carl A and Evans Lena M
Create a Home Valuation Report for This Property
The Home Valuation Report is an in-depth analysis detailing your home's value as well as a comparison with similar homes in the area
Home Values in the Area
Average Home Value in this Area
Purchase History
| Date | Buyer | Sale Price | Title Company |
|---|---|---|---|
| Gay Melody | $150,000 | Bxvalmer Land | |
| Houck Willis G | $214,900 | Talon Group | |
| Evans Carl A | -- | -- | |
| Evans Carl A | -- | -- |
Source: Public Records
Tax History Compared to Growth
Tax History
| Year | Tax Paid | Tax Assessment Tax Assessment Total Assessment is a certain percentage of the fair market value that is determined by local assessors to be the total taxable value of land and additions on the property. | Land | Improvement |
|---|---|---|---|---|
| 2024 | $6,819 | $125,550 | $35,000 | $90,550 |
| 2023 | $7,303 | $125,550 | $35,000 | $90,550 |
| 2022 | $6,227 | $83,380 | $14,180 | $69,200 |
| 2021 | $6,022 | $83,380 | $14,180 | $69,200 |
| 2020 | $5,972 | $83,380 | $14,180 | $69,200 |
| 2019 | $5,087 | $70,880 | $11,800 | $59,080 |
| 2018 | $4,896 | $70,880 | $11,800 | $59,080 |
| 2017 | $4,669 | $70,880 | $11,800 | $59,080 |
| 2016 | $4,737 | $65,490 | $15,650 | $49,840 |
| 2015 | $4,741 | $65,490 | $15,650 | $49,840 |
| 2014 | $4,704 | $65,490 | $15,650 | $49,840 |
| 2013 | $2,309 | $64,750 | $14,910 | $49,840 |
Source: Public Records
Map
Nearby Homes
- 219 N Hamilton Rd
- 477 Stratshire Ln
- 657 Picadilly Ct
- 488 Three Oaks Ct Unit 488
- 641 Sycamore Mill Dr
- 302 Zander Ln Unit 302
- 365 Sycamore Woods Ln Unit 365
- 206 Lintner St
- 211 Crossing Creek N
- 148 Sierra Dr
- 804 Riva Ridge Blvd
- 135 Serran Dr
- 107 Kinder Place
- 745 Fleetrun Ave
- 638 Churchill Dr
- 183 Serran Dr
- 4220 E Johnstown Rd
- 321 Flint Ridge Dr
- 108 Walcreek Dr W
- 0 Beecher Crossing
- 490 Langford Ct
- 480 Langford Ct
- 501 Wickham Way
- 505 Wickham Way
- 472 Langford Ct
- 477 Langford Ct
- 492 Langford Ct
- 497 Wickham Way
- 511 Wickham Way
- 462 Langford Ct
- 494 Langford Ct
- 495 Wickham Way
- 467 Langford Ct
- 487 Langford Ct
- 510 Wickham Way
- 454 Langford Ct
- 516 Clark State Rd
- 506 Wickham Way
- 493 Wickham Way
- 463 Tresham Rd