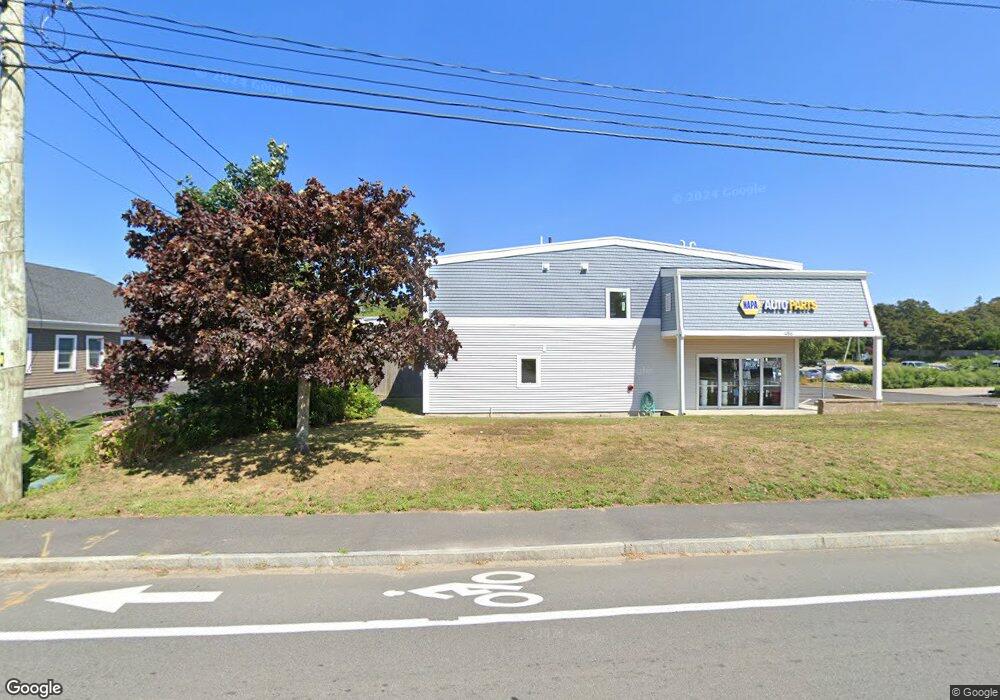
486 Main St Dennis Port, MA 02639
Dennis Port NeighborhoodEstimated Value: $990,129
--
Bed
--
Bath
5,698
Sq Ft
$174/Sq Ft
Est. Value
About This Home
This home is located at 486 Main St, Dennis Port, MA 02639 and is currently estimated at $990,129, approximately $173 per square foot. 486 Main St is a home located in Barnstable County with nearby schools including Dennis-Yarmouth Regional High School and St. Pius X. School.
Ownership History
Date
Name
Owned For
Owner Type
Purchase Details
Closed on
Oct 18, 2023
Sold by
West Todd
Bought by
486 Main Llc
Current Estimated Value
Home Financials for this Owner
Home Financials are based on the most recent Mortgage that was taken out on this home.
Original Mortgage
$736,000
Outstanding Balance
$720,173
Interest Rate
7.12%
Mortgage Type
New Conventional
Estimated Equity
$269,956
Purchase Details
Closed on
Jul 28, 2023
Sold by
New Life Christian Nt and Russell
Bought by
West Todd
Purchase Details
Closed on
Jan 28, 2000
Sold by
Rosamond C Hunter Nt and Fiske
Bought by
New Life Christian Nt and Gamble
Home Financials for this Owner
Home Financials are based on the most recent Mortgage that was taken out on this home.
Original Mortgage
$175,000
Interest Rate
7.83%
Mortgage Type
Commercial
Purchase Details
Closed on
Jul 24, 1992
Sold by
Interstate Theatres
Bought by
Fiske William P and Fiske Mary E
Create a Home Valuation Report for This Property
The Home Valuation Report is an in-depth analysis detailing your home's value as well as a comparison with similar homes in the area
Home Values in the Area
Average Home Value in this Area
Purchase History
| Date | Buyer | Sale Price | Title Company |
|---|---|---|---|
| 486 Main Llc | -- | None Available | |
| 486 Main Llc | -- | None Available | |
| West Todd | $920,000 | None Available | |
| West Todd | $920,000 | None Available | |
| New Life Christian Nt | $235,000 | -- | |
| New Life Christian Nt | $235,000 | -- | |
| Fiske William P | $150,000 | -- | |
| Fiske William P | $150,000 | -- |
Source: Public Records
Mortgage History
| Date | Status | Borrower | Loan Amount |
|---|---|---|---|
| Open | 486 Main Llc | $736,000 | |
| Closed | 486 Main Llc | $736,000 | |
| Previous Owner | New Life Christian Nt | $175,000 |
Source: Public Records
Tax History Compared to Growth
Tax History
| Year | Tax Paid | Tax Assessment Tax Assessment Total Assessment is a certain percentage of the fair market value that is determined by local assessors to be the total taxable value of land and additions on the property. | Land | Improvement |
|---|---|---|---|---|
| 2025 | $4,291 | $990,900 | $346,800 | $644,100 |
| 2024 | -- | $650,700 | $334,100 | $316,600 |
| 2023 | $0 | $617,600 | $317,100 | $300,500 |
| 2022 | $0 | $580,700 | $298,200 | $282,500 |
| 2021 | $0 | $563,700 | $292,300 | $271,400 |
| 2020 | $11,763 | $556,500 | $291,100 | $265,400 |
| 2019 | $11,225 | $527,200 | $264,300 | $262,900 |
| 2018 | $12,026 | $528,000 | $263,400 | $264,600 |
| 2017 | -- | $528,000 | $263,400 | $264,600 |
| 2016 | -- | $506,100 | $237,000 | $269,100 |
| 2015 | -- | $506,100 | $237,000 | $269,100 |
| 2014 | -- | $465,400 | $237,000 | $228,400 |
Source: Public Records
Map
Nearby Homes
- 10 Candlewood Ln Unit 2-1
- 12 Candlewood Ln Unit 2-9
- 9 Country Ln
- 166 Upper County Rd Unit 1-4
- 221 Upper County Rd Unit 2A
- 221 Upper County Rd Unit 2A
- 12 Cross St
- 159 Center St Unit 22
- 47 Telegraph Rd Unit 1
- 268 Main St
- 72 Bassett Ln
- 26 Manning Rd
- 73 Division St
- 141 Division St
- 78 Upper County Rd Unit A&B
- 78 Upper County Rd
- 141 Division St
- 22 Wixon Rd
- 24 Indian Trail
- 148 Belmont Rd