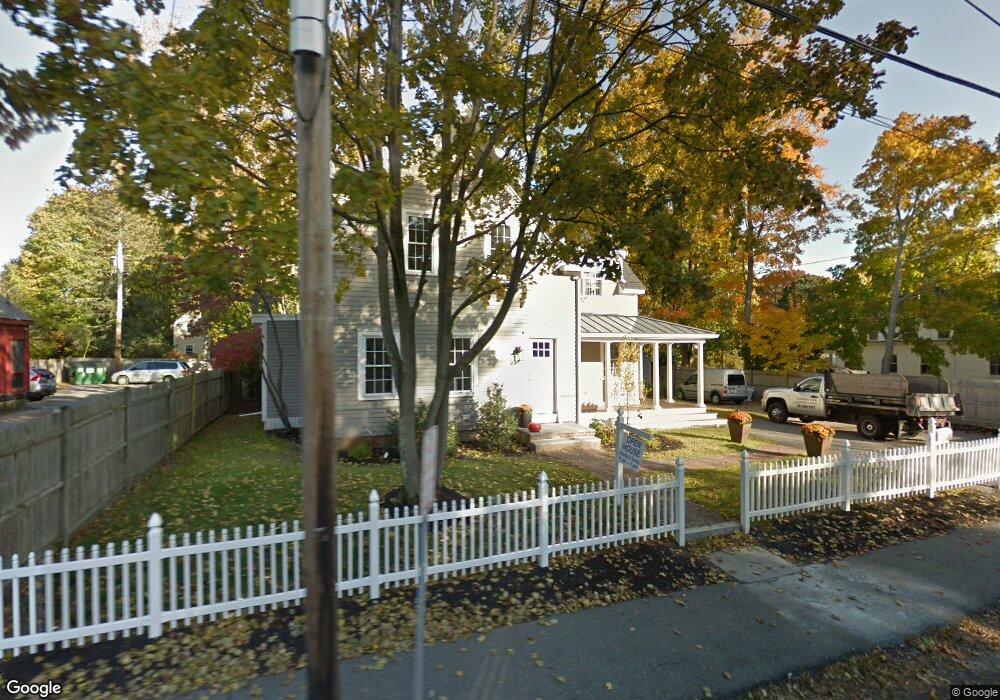
486 Main St Hingham, MA 02043
Estimated Value: $631,486 - $873,000
2
Beds
1
Bath
1,135
Sq Ft
$676/Sq Ft
Est. Value
About This Home
This home is located at 486 Main St, Hingham, MA 02043 and is currently estimated at $767,622, approximately $676 per square foot. 486 Main St is a home located in Plymouth County with nearby schools including East Elementary School, Hingham Middle School, and Hingham High School.
Ownership History
Date
Name
Owned For
Owner Type
Purchase Details
Closed on
Mar 28, 2011
Sold by
Scotton Lewis N
Bought by
Sarabia Elizabeth A
Current Estimated Value
Purchase Details
Closed on
Apr 13, 2001
Sold by
Devin Sharon L and Hayes Francis
Bought by
Scotton Lewis N
Home Financials for this Owner
Home Financials are based on the most recent Mortgage that was taken out on this home.
Original Mortgage
$121,600
Interest Rate
6.97%
Mortgage Type
Purchase Money Mortgage
Create a Home Valuation Report for This Property
The Home Valuation Report is an in-depth analysis detailing your home's value as well as a comparison with similar homes in the area
Purchase History
| Date | Buyer | Sale Price | Title Company |
|---|---|---|---|
| Sarabia Elizabeth A | $260,000 | -- | |
| Scotton Lewis N | $152,000 | -- |
Source: Public Records
Mortgage History
| Date | Status | Borrower | Loan Amount |
|---|---|---|---|
| Previous Owner | Scotton Lewis N | $170,300 | |
| Previous Owner | Scotton Lewis N | $170,000 | |
| Previous Owner | Scotton Lewis N | $121,600 | |
| Previous Owner | Scotton Lewis N | $116,000 |
Source: Public Records
Tax History Compared to Growth
Tax History
| Year | Tax Paid | Tax Assessment Tax Assessment Total Assessment is a certain percentage of the fair market value that is determined by local assessors to be the total taxable value of land and additions on the property. | Land | Improvement |
|---|---|---|---|---|
| 2025 | $5,174 | $484,000 | $294,800 | $189,200 |
| 2024 | $5,091 | $469,200 | $294,800 | $174,400 |
| 2023 | $4,436 | $443,600 | $273,700 | $169,900 |
| 2022 | $4,274 | $369,700 | $238,600 | $131,100 |
| 2021 | $4,175 | $353,800 | $238,600 | $115,200 |
| 2020 | $4,079 | $353,800 | $238,600 | $115,200 |
| 2019 | $4,098 | $347,000 | $238,600 | $108,400 |
| 2018 | $3,923 | $333,300 | $238,600 | $94,700 |
| 2017 | $4,105 | $335,100 | $240,500 | $94,600 |
| 2016 | $3,863 | $309,300 | $229,100 | $80,200 |
| 2015 | $3,543 | $282,800 | $202,600 | $80,200 |
Source: Public Records
Map
Nearby Homes