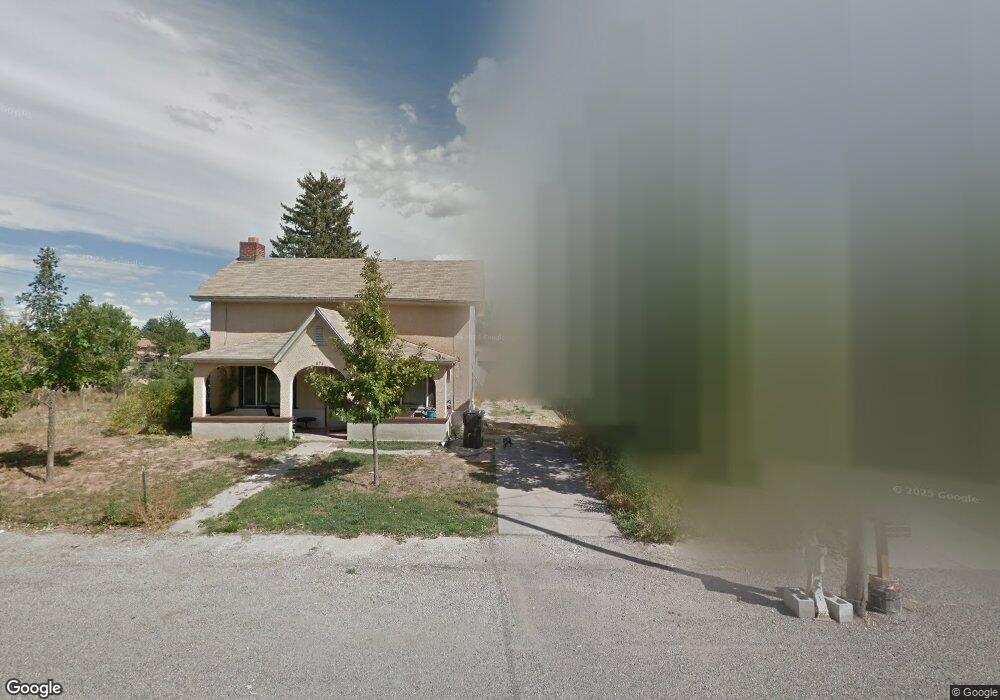
486 N 100 E Richfield, UT 84701
Estimated Value: $254,000 - $290,000
Studio
--
Bath
1,422
Sq Ft
$191/Sq Ft
Est. Value
About This Home
This home is located at 486 N 100 E, Richfield, UT 84701 and is currently estimated at $271,302, approximately $190 per square foot. 486 N 100 E is a home located in Sevier County with nearby schools including Pahvant School, Ashman School, and Red Hills Middle School.
Ownership History
Date
Name
Owned For
Owner Type
Purchase Details
Closed on
Jul 17, 2017
Sold by
Christensen Jill and Christensen David A
Bought by
Richards Kevin T and Richards Abigail Janell
Current Estimated Value
Home Financials for this Owner
Home Financials are based on the most recent Mortgage that was taken out on this home.
Original Mortgage
$136,363
Outstanding Balance
$112,626
Interest Rate
3.94%
Estimated Equity
$158,676
Purchase Details
Closed on
Aug 2, 2013
Sold by
Mendenhall Gregory B
Bought by
Christensen Jill and Christensen David A
Home Financials for this Owner
Home Financials are based on the most recent Mortgage that was taken out on this home.
Original Mortgage
$91,315
Interest Rate
4.4%
Mortgage Type
FHA
Create a Home Valuation Report for This Property
The Home Valuation Report is an in-depth analysis detailing your home's value as well as a comparison with similar homes in the area
Purchase History
| Date | Buyer | Sale Price | Title Company |
|---|---|---|---|
| Richards Kevin T | -- | None Available | |
| Christensen Jill | -- | Utah Title & Abstract |
Source: Public Records
Mortgage History
| Date | Status | Borrower | Loan Amount |
|---|---|---|---|
| Open | Richards Kevin T | $136,363 | |
| Previous Owner | Christensen Jill | $91,315 |
Source: Public Records
Tax History
| Year | Tax Paid | Tax Assessment Tax Assessment Total Assessment is a certain percentage of the fair market value that is determined by local assessors to be the total taxable value of land and additions on the property. | Land | Improvement |
|---|---|---|---|---|
| 2025 | $1,221 | $125,743 | $41,562 | $84,181 |
| 2024 | $1,221 | $129,697 | $33,943 | $95,754 |
| 2023 | $1,283 | $142,890 | $31,228 | $111,662 |
| 2022 | $1,270 | $115,922 | $26,638 | $89,284 |
| 2021 | $1,157 | $88,945 | $27,397 | $61,548 |
| 2020 | $1,054 | $78,751 | $19,246 | $59,505 |
| 2019 | $893 | $70,600 | $16,040 | $54,560 |
| 2018 | $884 | $62,680 | $16,040 | $46,640 |
| 2017 | $745 | $50,390 | $16,040 | $34,350 |
| 2016 | $588 | $50,390 | $0 | $0 |
| 2015 | $588 | $46,210 | $0 | $0 |
| 2014 | $588 | $43,940 | $0 | $0 |
Source: Public Records
Map
Nearby Homes
Your Personal Tour Guide
Ask me questions while you tour the home.