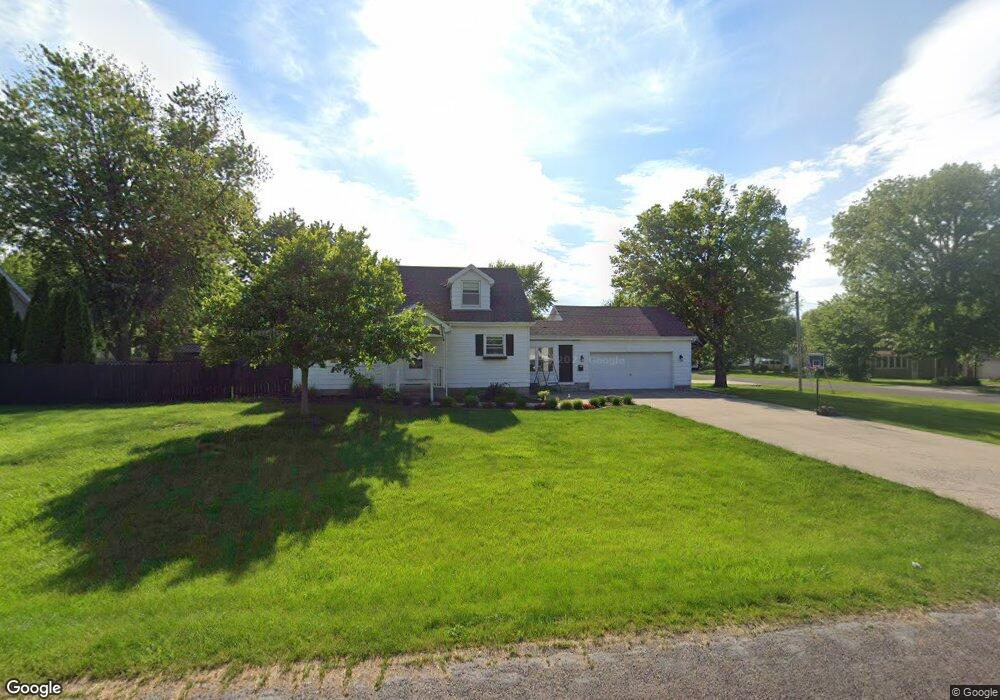
486 N Chestnut St El Paso, IL 61738
Estimated Value: $190,000 - $221,930
3
Beds
2
Baths
2,587
Sq Ft
$81/Sq Ft
Est. Value
About This Home
This home is located at 486 N Chestnut St, El Paso, IL 61738 and is currently estimated at $210,483, approximately $81 per square foot. 486 N Chestnut St is a home located in Woodford County with nearby schools including El Paso-Gridley High School.
Ownership History
Date
Name
Owned For
Owner Type
Purchase Details
Closed on
Mar 17, 2022
Sold by
Betts Bryan D and Betts Tamara S
Bought by
Augsburger Taylor
Current Estimated Value
Home Financials for this Owner
Home Financials are based on the most recent Mortgage that was taken out on this home.
Original Mortgage
$100,000
Outstanding Balance
$80,975
Interest Rate
3.38%
Mortgage Type
New Conventional
Estimated Equity
$129,508
Purchase Details
Closed on
Sep 14, 2021
Sold by
Adams Jeannie D
Bought by
Betts Bryan D and Betts Tamara S
Create a Home Valuation Report for This Property
The Home Valuation Report is an in-depth analysis detailing your home's value as well as a comparison with similar homes in the area
Home Values in the Area
Average Home Value in this Area
Purchase History
| Date | Buyer | Sale Price | Title Company |
|---|---|---|---|
| Augsburger Taylor | $162,500 | Stoller Law Office | |
| Betts Bryan D | -- | Woodford County Title |
Source: Public Records
Mortgage History
| Date | Status | Borrower | Loan Amount |
|---|---|---|---|
| Open | Augsburger Taylor | $100,000 |
Source: Public Records
Tax History Compared to Growth
Tax History
| Year | Tax Paid | Tax Assessment Tax Assessment Total Assessment is a certain percentage of the fair market value that is determined by local assessors to be the total taxable value of land and additions on the property. | Land | Improvement |
|---|---|---|---|---|
| 2024 | $4,076 | $56,902 | $7,507 | $49,395 |
| 2023 | $3,767 | $51,748 | $6,827 | $44,921 |
| 2022 | $4,061 | $47,884 | $6,317 | $41,567 |
| 2021 | $3,879 | $45,216 | $5,965 | $39,251 |
| 2020 | $3,795 | $44,005 | $5,805 | $38,200 |
| 2019 | $3,722 | $44,005 | $5,805 | $38,200 |
| 2018 | $3,746 | $43,612 | $5,753 | $37,859 |
| 2017 | $3,727 | $43,180 | $5,696 | $37,484 |
| 2016 | $3,717 | $42,753 | $5,640 | $37,113 |
| 2015 | $3,124 | $41,540 | $5,480 | $36,060 |
| 2014 | $3,124 | $41,358 | $5,456 | $35,902 |
| 2013 | $3,124 | $40,973 | $5,405 | $35,568 |
Source: Public Records
Map
Nearby Homes
- 142 E 5th St
- 440 N Chestnut St
- 122 E 5th St
- 497 N Chestnut St
- 475 N Chestnut St
- 402 N Chestnut St
- 193 E 5th St Unit 3
- 147 E 4th St
- 497 N Cherry St
- 155 E 5th St
- 425 N Chestnut St
- 180 E 5th St
- 501 N Chestnut St
- 115 E 5th St
- 101 E 4th St
- 401 N Chestnut St
- 103 E 5th St
- 398 N Chestnut St
- 298 E 5th St
- 468 N Pine St