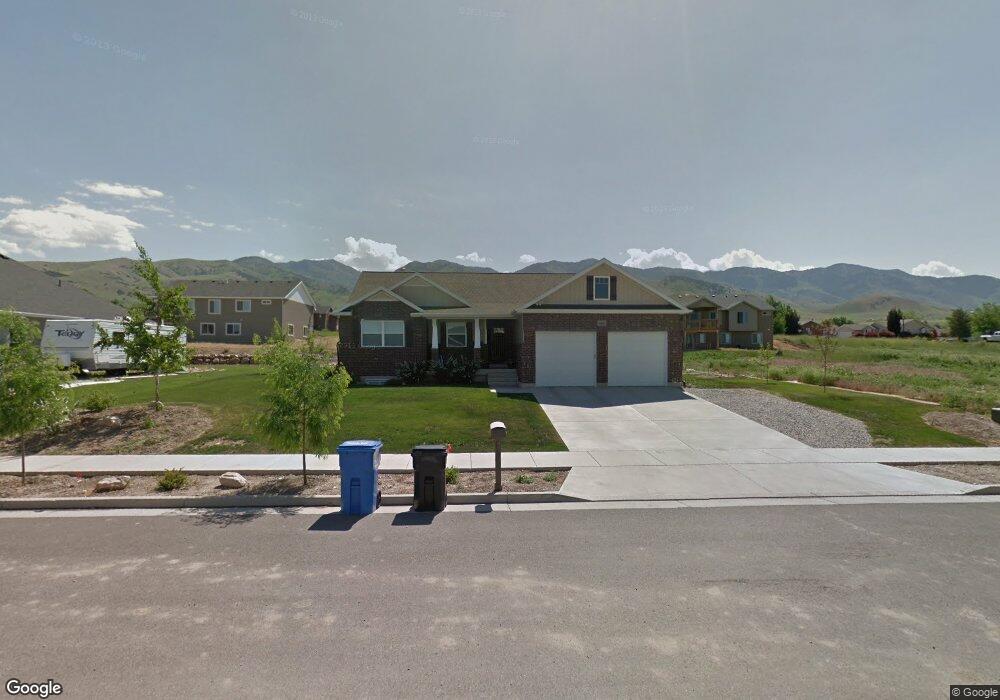
486 S 660 E Smithfield, UT 84335
Estimated Value: $500,000 - $609,000
Studio
--
Bath
1,602
Sq Ft
$355/Sq Ft
Est. Value
About This Home
This home is located at 486 S 660 E, Smithfield, UT 84335 and is currently estimated at $568,399, approximately $354 per square foot. 486 S 660 E is a home with nearby schools including Sunrise School, Cedar Ridge School, and North Cache Middle School.
Ownership History
Date
Name
Owned For
Owner Type
Purchase Details
Closed on
Oct 19, 2007
Sold by
Moser Shawn and Moser Yuri
Bought by
Jones Max H and Jones Laurie T
Current Estimated Value
Home Financials for this Owner
Home Financials are based on the most recent Mortgage that was taken out on this home.
Original Mortgage
$52,400
Outstanding Balance
$32,697
Interest Rate
6.29%
Mortgage Type
Purchase Money Mortgage
Estimated Equity
$535,702
Create a Home Valuation Report for This Property
The Home Valuation Report is an in-depth analysis detailing your home's value as well as a comparison with similar homes in the area
Home Values in the Area
Average Home Value in this Area
Purchase History
| Date | Buyer | Sale Price | Title Company |
|---|---|---|---|
| Jones Max H | -- | Hickman Land Title Company |
Source: Public Records
Mortgage History
| Date | Status | Borrower | Loan Amount |
|---|---|---|---|
| Open | Jones Max H | $52,400 |
Source: Public Records
Tax History
| Year | Tax Paid | Tax Assessment Tax Assessment Total Assessment is a certain percentage of the fair market value that is determined by local assessors to be the total taxable value of land and additions on the property. | Land | Improvement |
|---|---|---|---|---|
| 2025 | $2,349 | $314,430 | $0 | $0 |
| 2024 | $252 | $316,765 | $0 | $0 |
| 2023 | $2,642 | $313,720 | $0 | $0 |
| 2022 | $2,685 | $313,720 | $0 | $0 |
| 2021 | $2,078 | $371,039 | $75,000 | $296,039 |
| 2020 | $1,996 | $332,426 | $75,000 | $257,426 |
| 2019 | $1,987 | $315,426 | $58,000 | $257,426 |
| 2018 | $1,875 | $287,845 | $58,000 | $229,845 |
| 2017 | $1,816 | $152,295 | $0 | $0 |
| 2016 | $1,848 | $129,085 | $0 | $0 |
| 2015 | $1,573 | $129,085 | $0 | $0 |
| 2014 | $1,545 | $129,360 | $0 | $0 |
| 2013 | -- | $129,360 | $0 | $0 |
Source: Public Records
Map
Nearby Homes
- 127 S 830 E Unit 304
- 396 S 455 E
- 434 S Cardon Ridge Dr
- 641 S 380 E
- 641 S 1080 E Unit 44
- 1092 E 300 S
- 670 S 1080 E Unit 37
- 628 S 1080 E
- 577 S 1140 E Unit 1202
- 413 S 1150 E Unit 1101
- 722 S 1040 E Unit 21
- 776 S 1150 E
- 12 S 1150 E Unit 8
- 738 S 1150 E Unit 9
- 805 S 270 E Unit 1
- 809 S 270 E Unit 2
- 813 S 270 E Unit 3
- 817 S 270 E Unit 4
- 161 E 560 S
- 821 S 270 E Unit 5
- 498 S 660 E Unit 128
- 470 S 660 E
- 501 S 700 E
- 501 S 700 E Unit 138
- 511 S 700 E
- 491 S 700 E
- 485 S 660 E Unit 116
- 485 S 660 E
- 497 S 660 E
- 497 S 660 E Unit 117
- 469 S 660 E
- 514 S 660 E
- 514 S 660 E Unit 129
- 456 S 660 E
- 521 S 700 E
- 469 S 700 E Unit 136
- 513 S 660 E Unit 118
- 513 S 660 E
- 455 S 660 E
- 488 S 620 E
Your Personal Tour Guide
Ask me questions while you tour the home.