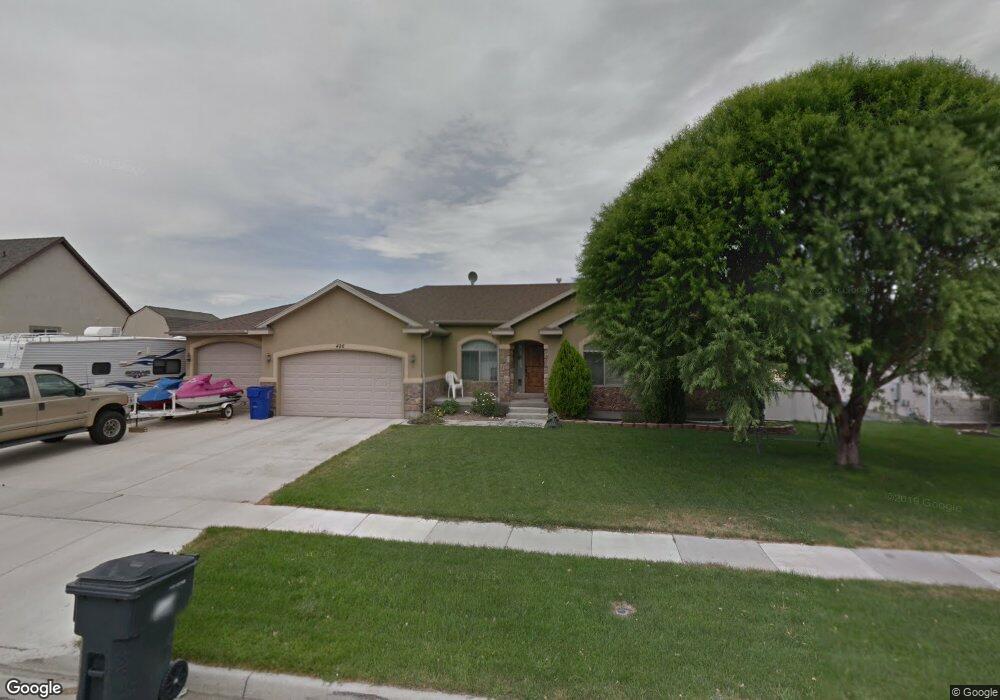
486 W Meadow Crest Way Saratoga Springs, UT 84045
Estimated Value: $591,000 - $650,000
3
Beds
3
Baths
1,411
Sq Ft
$432/Sq Ft
Est. Value
About This Home
This home is located at 486 W Meadow Crest Way, Saratoga Springs, UT 84045 and is currently estimated at $609,280, approximately $431 per square foot. 486 W Meadow Crest Way is a home located in Utah County with nearby schools including Saratoga Shores Elementary School, Lake Mountain Middle School, and Westlake High School.
Ownership History
Date
Name
Owned For
Owner Type
Purchase Details
Closed on
Jul 27, 2017
Sold by
Hill Troy and Hill Kjristina
Bought by
Elmer Ricky
Current Estimated Value
Home Financials for this Owner
Home Financials are based on the most recent Mortgage that was taken out on this home.
Original Mortgage
$317,300
Outstanding Balance
$264,404
Interest Rate
3.91%
Estimated Equity
$344,876
Purchase Details
Closed on
Sep 1, 2005
Sold by
Desert Point Builders Inc
Bought by
Hill Troy and Hill Kjristina
Home Financials for this Owner
Home Financials are based on the most recent Mortgage that was taken out on this home.
Original Mortgage
$239,850
Interest Rate
2%
Purchase Details
Closed on
Jun 2, 2005
Sold by
Benches 2A Llc
Bought by
Desert Point Builders Inc
Home Financials for this Owner
Home Financials are based on the most recent Mortgage that was taken out on this home.
Original Mortgage
$172,000
Interest Rate
5.72%
Mortgage Type
Small Business Administration
Create a Home Valuation Report for This Property
The Home Valuation Report is an in-depth analysis detailing your home's value as well as a comparison with similar homes in the area
Home Values in the Area
Average Home Value in this Area
Purchase History
| Date | Buyer | Sale Price | Title Company |
|---|---|---|---|
| Elmer Ricky | -- | Title Guarantee | |
| Hill Troy | -- | Integrated Title Insurance | |
| Desert Point Builders Inc | -- | Integrated Title Insurance |
Source: Public Records
Mortgage History
| Date | Status | Borrower | Loan Amount |
|---|---|---|---|
| Open | Elmer Ricky | $317,300 | |
| Previous Owner | Hill Troy | $239,850 | |
| Previous Owner | Desert Point Builders Inc | $172,000 |
Source: Public Records
Tax History Compared to Growth
Tax History
| Year | Tax Paid | Tax Assessment Tax Assessment Total Assessment is a certain percentage of the fair market value that is determined by local assessors to be the total taxable value of land and additions on the property. | Land | Improvement |
|---|---|---|---|---|
| 2025 | $2,410 | $565,400 | $268,000 | $297,400 |
| 2024 | $2,410 | $289,465 | $0 | $0 |
| 2023 | $2,244 | $289,850 | $0 | $0 |
| 2022 | $2,460 | $309,870 | $0 | $0 |
| 2021 | $2,107 | $396,100 | $143,200 | $252,900 |
| 2020 | $2,010 | $371,100 | $127,900 | $243,200 |
| 2019 | $1,749 | $334,500 | $120,300 | $214,200 |
| 2018 | $1,768 | $319,000 | $112,800 | $206,200 |
| 2017 | $1,560 | $150,645 | $0 | $0 |
| 2016 | $1,555 | $139,315 | $0 | $0 |
| 2015 | $1,581 | $134,420 | $0 | $0 |
| 2014 | $1,559 | $131,010 | $0 | $0 |
Source: Public Records
Map
Nearby Homes
- 1259 S Jake Dr
- 1271 S Jake Dr
- 1291 S Jake Dr
- 1307 S Jake Dr
- 1288 S Pondside Dr
- 332 W Hillside Dr
- 317 W Farmside Dr
- 1263 Glambert Ln Unit 128
- 1283 Glambert Ln Unit 130
- 563 W Founders Blvd Unit 90
- 771 W Meadow Side Dr
- 1497 S Overlook Ln
- 903 W Black Tail St Unit 222
- 917 W Black Tail St Unit 223
- 881 W Black Tail St Unit 220
- 893 W Black Tail St Unit 221
- 1249 S Jake Dr
- 903 W Fallow Dr Unit 212
- 867 W Fallow Dr Unit 209
- 903 W Black Tail St
- 468 W Meadow Crest Way
- 502 W Meadow Crest Way
- 502 Meadow Crest Way
- 1233 S Hayfield Ln
- 503 W Meadow Crest Way
- 503 W Meadow Crest Way
- 1247 Meadow Crest Way
- 1247 Hayfield Ln
- 1248 Alpine Dr
- 1248 S Alpine Dr
- 526 W Meadow Crest Way
- 526 W Meadow Crest Way Unit 203
- 526 W Meadow Crest Way
- 1233 S Alpine Dr
- 1233 Alpine Dr
- 1262 Alpine Dr
- 1262 S Alpine Dr
- 542 Meadow Crest Way
- 1247 Alpine Dr
- 1263 Meadow Crest Way