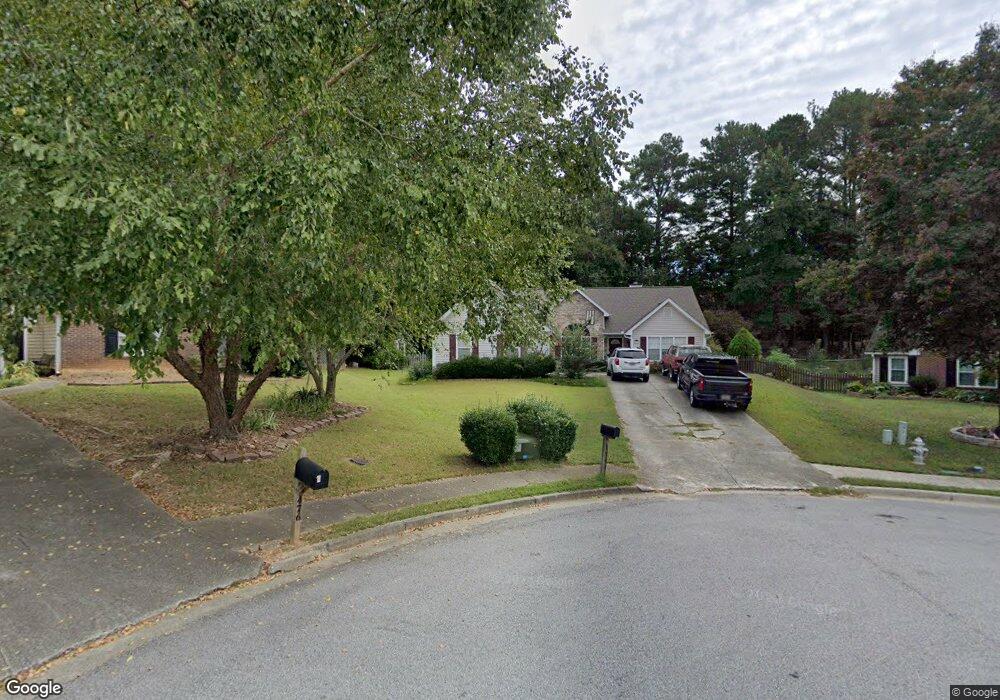
486 Wetherby View Sugar Hill, GA 30518
Estimated Value: $368,000 - $411,000
3
Beds
2
Baths
1,683
Sq Ft
$234/Sq Ft
Est. Value
About This Home
This home is located at 486 Wetherby View, Sugar Hill, GA 30518 and is currently estimated at $393,614, approximately $233 per square foot. 486 Wetherby View is a home located in Gwinnett County with nearby schools including Sugar Hill Elementary School, Lanier Middle School, and Lanier High School.
Ownership History
Date
Name
Owned For
Owner Type
Purchase Details
Closed on
Apr 22, 2004
Sold by
Hamman Kyle A and Hamman Alicia A
Bought by
Corathers Kristopher T
Current Estimated Value
Home Financials for this Owner
Home Financials are based on the most recent Mortgage that was taken out on this home.
Original Mortgage
$33,380
Interest Rate
4.69%
Mortgage Type
Unknown
Purchase Details
Closed on
Jul 12, 2002
Sold by
Johnson Marjorie Z
Bought by
Walker Alicia A
Home Financials for this Owner
Home Financials are based on the most recent Mortgage that was taken out on this home.
Original Mortgage
$122,400
Interest Rate
6.67%
Mortgage Type
New Conventional
Purchase Details
Closed on
Mar 25, 2002
Sold by
Mcaleer Marjorie J
Bought by
Johnson Marjorie Z
Purchase Details
Closed on
Oct 11, 2000
Sold by
Johnson Jack K and Johnson Marjorie Z
Bought by
Mcaleer Marjorie J
Purchase Details
Closed on
Dec 21, 1995
Sold by
Bowen Builders Group Inc
Bought by
Johnson Jack K Marjorie
Create a Home Valuation Report for This Property
The Home Valuation Report is an in-depth analysis detailing your home's value as well as a comparison with similar homes in the area
Home Values in the Area
Average Home Value in this Area
Purchase History
| Date | Buyer | Sale Price | Title Company |
|---|---|---|---|
| Corathers Kristopher T | $166,900 | -- | |
| Walker Alicia A | $153,000 | -- | |
| Johnson Marjorie Z | -- | -- | |
| Mcaleer Marjorie J | -- | -- | |
| Johnson Jack K Marjorie | $110,900 | -- |
Source: Public Records
Mortgage History
| Date | Status | Borrower | Loan Amount |
|---|---|---|---|
| Closed | Corathers Kristopher T | $33,380 | |
| Open | Corathers Kristopher T | $133,520 | |
| Previous Owner | Walker Alicia A | $122,400 | |
| Closed | Johnson Jack K Marjorie | $0 |
Source: Public Records
Tax History Compared to Growth
Tax History
| Year | Tax Paid | Tax Assessment Tax Assessment Total Assessment is a certain percentage of the fair market value that is determined by local assessors to be the total taxable value of land and additions on the property. | Land | Improvement |
|---|---|---|---|---|
| 2025 | $550 | $141,760 | $34,000 | $107,760 |
| 2024 | $4,921 | $141,000 | $28,000 | $113,000 |
| 2023 | $4,921 | $129,240 | $19,600 | $109,640 |
| 2022 | $4,523 | $129,240 | $19,600 | $109,640 |
| 2021 | $3,581 | $100,320 | $19,600 | $80,720 |
| 2020 | $3,729 | $92,440 | $16,000 | $76,440 |
| 2019 | $3,457 | $88,720 | $16,000 | $72,720 |
| 2018 | $2,958 | $75,400 | $13,600 | $61,800 |
| 2016 | $2,788 | $71,080 | $13,600 | $57,480 |
| 2015 | $2,526 | $63,520 | $11,000 | $52,520 |
| 2014 | $2,128 | $53,000 | $11,000 | $42,000 |
Source: Public Records
Map
Nearby Homes
- 518 Bellingham Dr
- 5340 Candun Cir
- 5259 Leecroft Dr
- 5365 Maltdie Ct
- 581 Sweetfern Ln
- 5301 Regency Lake Ct
- 0 Rear Silk Oak Way
- 5156 Allison Way
- 491 Sweetfern Ln
- 5445 Maltdie Ct
- 623 Friars Head Ct
- 5390 Regency Lake Ct
- 614 Hickory Nobb
- 5381 Front Runner Ct
- 5422 Pepperbush Ct
- 5109 Dogwood Hills Dr
- 5055 Puritan Dr
- 5040 Puritan Dr
- 476 Wetherby View
- 476 Wetherby View Unit 1
- 487 Wetherby View
- 5150 Winter Haven Walk
- 5140 Winter Haven Walk
- 5160 Winter Haven Walk
- 477 Wetherby View Unit 1
- 5130 Winter Haven Walk
- 5130 Winter Haven Walk
- 5170 Winter Haven Walk
- 5165 Edinborough Place
- 0 Edinborough Place Unit 8586449
- 0 Edinborough Place Unit 9006312
- 0 Edinborough Place Unit 8682194
- 0 Edinborough Place Unit 8831282
- 0 Edinborough Place Unit 8865658
- 0 Edinborough Place Unit 8919708
- 0 Edinborough Place Unit 7428253
- 5120 Winter Haven Walk
- 467 Wetherby View Unit 1