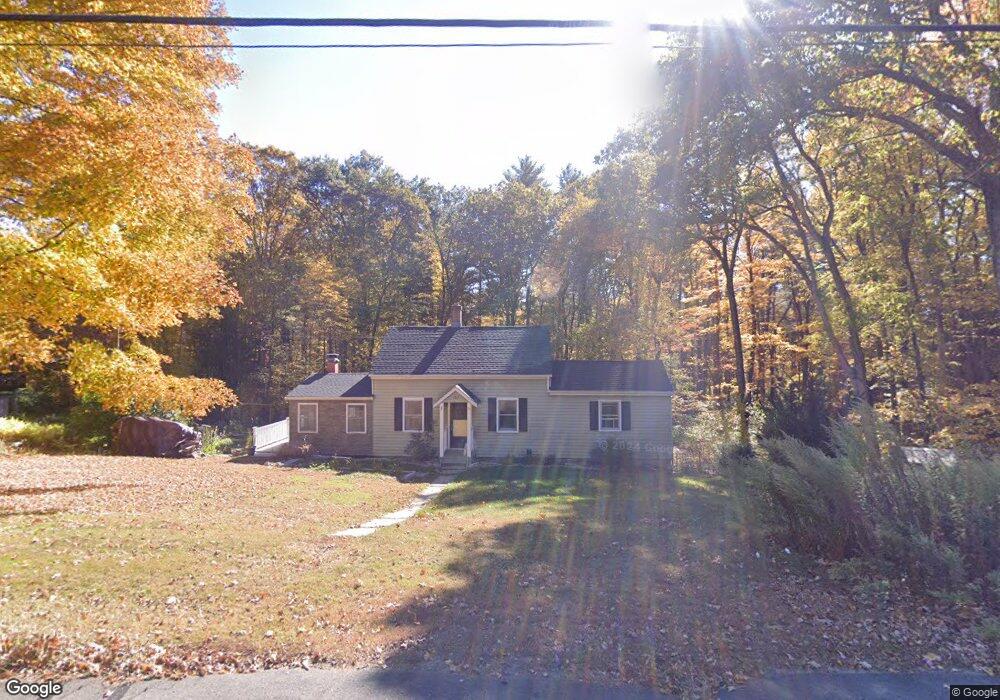
486 Woodtick Rd Wolcott, CT 06716
Estimated Value: $290,000 - $389,000
4
Beds
6
Baths
1,567
Sq Ft
$216/Sq Ft
Est. Value
About This Home
This home is located at 486 Woodtick Rd, Wolcott, CT 06716 and is currently estimated at $338,486, approximately $216 per square foot. 486 Woodtick Rd is a home located in New Haven County with nearby schools including Tyrrell Middle School, Wolcott High School, and St Peter & Paul School.
Ownership History
Date
Name
Owned For
Owner Type
Purchase Details
Closed on
Dec 21, 2015
Sold by
Clarke Wayne K
Bought by
Clarke Rebecca J
Current Estimated Value
Purchase Details
Closed on
Feb 26, 2010
Sold by
Gauthier Mark
Bought by
Clarke Wayne K and Clarke Rebecca J
Home Financials for this Owner
Home Financials are based on the most recent Mortgage that was taken out on this home.
Original Mortgage
$160,000
Interest Rate
4.5%
Mortgage Type
FHA
Purchase Details
Closed on
May 9, 2006
Sold by
Hellman Karen
Bought by
Gauthier Mark
Home Financials for this Owner
Home Financials are based on the most recent Mortgage that was taken out on this home.
Original Mortgage
$10,000
Interest Rate
6.62%
Purchase Details
Closed on
Dec 17, 2004
Sold by
Gauthier William F and Willette Mary
Bought by
Gauthier Mark and Hellmann Karen
Create a Home Valuation Report for This Property
The Home Valuation Report is an in-depth analysis detailing your home's value as well as a comparison with similar homes in the area
Home Values in the Area
Average Home Value in this Area
Purchase History
| Date | Buyer | Sale Price | Title Company |
|---|---|---|---|
| Clarke Rebecca J | -- | -- | |
| Clarke Wayne K | $163,000 | -- | |
| Gauthier Mark | $10,000 | -- | |
| Gauthier Mark | $137,500 | -- |
Source: Public Records
Mortgage History
| Date | Status | Borrower | Loan Amount |
|---|---|---|---|
| Previous Owner | Gauthier Mark | $160,000 | |
| Previous Owner | Gauthier Mark | $11,200 | |
| Previous Owner | Gauthier Mark | $25,000 | |
| Previous Owner | Gauthier Mark | $10,000 |
Source: Public Records
Tax History Compared to Growth
Tax History
| Year | Tax Paid | Tax Assessment Tax Assessment Total Assessment is a certain percentage of the fair market value that is determined by local assessors to be the total taxable value of land and additions on the property. | Land | Improvement |
|---|---|---|---|---|
| 2025 | $4,292 | $119,450 | $38,240 | $81,210 |
| 2024 | $3,950 | $119,450 | $38,240 | $81,210 |
| 2023 | $3,807 | $119,450 | $38,240 | $81,210 |
| 2022 | $3,679 | $119,450 | $38,240 | $81,210 |
| 2021 | $3,372 | $101,750 | $36,100 | $65,650 |
| 2020 | $3,372 | $101,750 | $36,100 | $65,650 |
| 2019 | $3,372 | $101,750 | $36,100 | $65,650 |
| 2018 | $3,276 | $101,750 | $36,100 | $65,650 |
| 2017 | $3,182 | $101,750 | $36,100 | $65,650 |
| 2016 | $3,276 | $113,330 | $37,040 | $76,290 |
| 2015 | $3,182 | $113,330 | $37,040 | $76,290 |
| 2014 | $3,079 | $113,330 | $37,040 | $76,290 |
Source: Public Records
Map
Nearby Homes
- 1209 Woodtick Rd
- 2 Old Farms Rd
- 00 Woodtick Rd
- 0 Woodtick Rd Unit 24119429
- 0 Bound Line Rd Unit 170253486
- 20 Wolf Hill Rd Unit 4D
- 20 Wolf Hill Rd Unit 6F
- 77 S Colman Rd
- 143 Bound Line Rd
- 0 Coe Rd
- 210 Munson Rd Unit 2-G
- 210 Munson Rd Unit 2-F
- 210 Munson Rd Unit 2-E
- 210 Munson Rd Unit 2-D
- 210 Munson Rd Unit 2-C
- 210 Munson Rd Unit 2-B
- 210 Munson Rd Unit 2-A
- 210 Munson Rd Unit 2-H
- 210 Munson Rd Unit 3A
- 210 Munson Rd Unit 3C