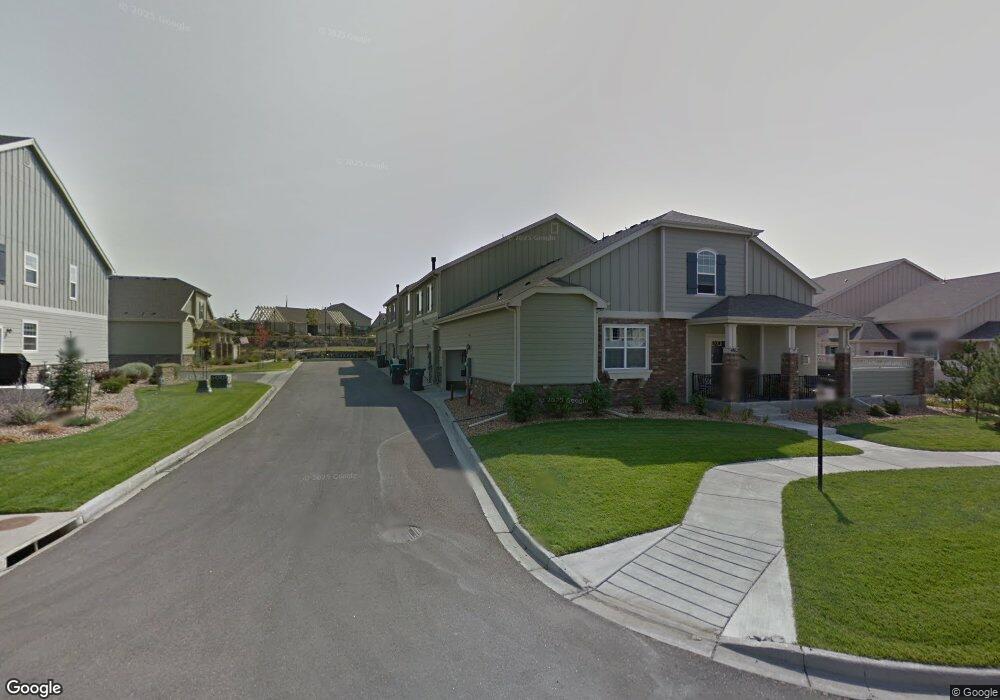
4860 Raven Run Broomfield, CO 80023
North Broomfield NeighborhoodEstimated Value: $545,106 - $618,000
3
Beds
4
Baths
2,341
Sq Ft
$252/Sq Ft
Est. Value
About This Home
This home is located at 4860 Raven Run, Broomfield, CO 80023 and is currently estimated at $589,027, approximately $251 per square foot. 4860 Raven Run is a home located in Broomfield County with nearby schools including Coyote Ridge Elementary School, Westlake Middle School, and Legacy High School.
Ownership History
Date
Name
Owned For
Owner Type
Purchase Details
Closed on
Nov 18, 2013
Sold by
Priesmeyer Linda I and Priesmeyer Steven T
Bought by
Harrison Mark S
Current Estimated Value
Home Financials for this Owner
Home Financials are based on the most recent Mortgage that was taken out on this home.
Original Mortgage
$252,000
Outstanding Balance
$188,968
Interest Rate
4.37%
Mortgage Type
Adjustable Rate Mortgage/ARM
Estimated Equity
$400,059
Purchase Details
Closed on
May 3, 2010
Sold by
Standard Pacific Of Colorado Inc
Bought by
Priesmeyer Linda I and Priesmeyer Steven T
Home Financials for this Owner
Home Financials are based on the most recent Mortgage that was taken out on this home.
Original Mortgage
$213,700
Interest Rate
4.93%
Mortgage Type
New Conventional
Create a Home Valuation Report for This Property
The Home Valuation Report is an in-depth analysis detailing your home's value as well as a comparison with similar homes in the area
Home Values in the Area
Average Home Value in this Area
Purchase History
| Date | Buyer | Sale Price | Title Company |
|---|---|---|---|
| Harrison Mark S | $315,000 | Fidelity National Title Insu | |
| Priesmeyer Linda I | $267,145 | Land Title Guarantee Company |
Source: Public Records
Mortgage History
| Date | Status | Borrower | Loan Amount |
|---|---|---|---|
| Open | Harrison Mark S | $252,000 | |
| Previous Owner | Priesmeyer Linda I | $213,700 |
Source: Public Records
Tax History Compared to Growth
Tax History
| Year | Tax Paid | Tax Assessment Tax Assessment Total Assessment is a certain percentage of the fair market value that is determined by local assessors to be the total taxable value of land and additions on the property. | Land | Improvement |
|---|---|---|---|---|
| 2025 | $5,012 | $37,410 | $8,040 | $29,370 |
| 2024 | $5,012 | $35,740 | $7,590 | $28,150 |
| 2023 | $4,977 | $40,900 | $8,690 | $32,210 |
| 2022 | $4,312 | $29,540 | $6,260 | $23,280 |
| 2021 | $4,444 | $30,390 | $6,440 | $23,950 |
| 2020 | $4,269 | $28,950 | $6,080 | $22,870 |
| 2019 | $4,271 | $29,150 | $6,120 | $23,030 |
| 2018 | $3,989 | $26,430 | $5,400 | $21,030 |
| 2017 | $3,712 | $29,220 | $5,970 | $23,250 |
| 2016 | $3,746 | $26,150 | $3,980 | $22,170 |
| 2015 | $3,746 | $22,870 | $3,980 | $18,890 |
| 2014 | $3,391 | $22,870 | $3,980 | $18,890 |
Source: Public Records
Map
Nearby Homes
- 4859 Raven Run
- 4892 Raven Run
- 4822 Raven Run
- 4795 Raven Run
- 5033 Silver Feather Way
- 4475 Eagle River Run
- 4620 White Rock Dr
- 3454 W 154th Place
- 3439 W 154th Ave
- 3434 W 154th Place
- 3427 W 154th Place
- 3422 W 155th Ave
- 14578 Benton St
- 4725 Spyglass Dr
- 14311 Cottage Way
- 14534 Fenton St
- 5151 Spyglass Dr
- 4945 Prebles Place Unit 4945
- 4405 Fairway Ln
- 4534 Fairway Ln