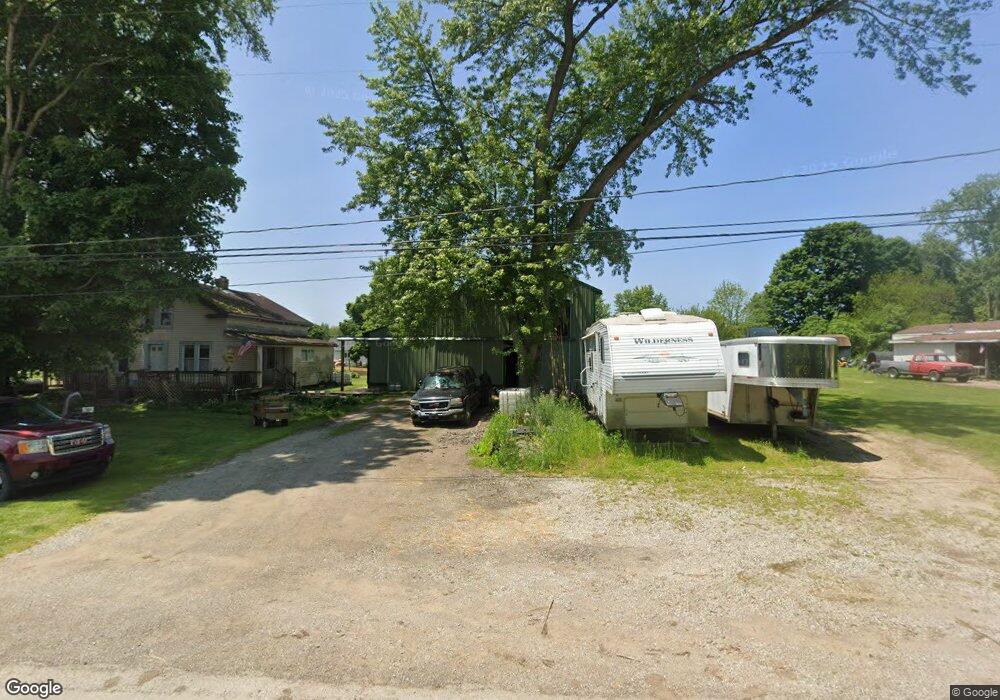
4861 State Rd Conneaut, OH 44030
Kingsville NeighborhoodEstimated Value: $120,312 - $167,000
2
Beds
1
Bath
1,008
Sq Ft
$137/Sq Ft
Est. Value
About This Home
This home is located at 4861 State Rd, Conneaut, OH 44030 and is currently estimated at $138,078, approximately $136 per square foot. 4861 State Rd is a home located in Ashtabula County with nearby schools including Kingsville Elementary School, Ridgeview Elementary School, and Wallace H. Braden Junior High School.
Ownership History
Date
Name
Owned For
Owner Type
Purchase Details
Closed on
Feb 2, 2016
Sold by
Pistey Robert D
Bought by
Pixley Bruce L
Current Estimated Value
Purchase Details
Closed on
May 8, 2007
Sold by
Pixley Leisa G
Bought by
Pikley Robert
Purchase Details
Closed on
Jul 26, 2006
Sold by
Us Bank Na
Bought by
Pixley Leisa G and Pixley Robert
Purchase Details
Closed on
Mar 4, 2004
Sold by
Mccall Jason and Mccall Mary
Bought by
U S Bank Na
Purchase Details
Closed on
Jul 22, 1997
Sold by
Bobey Susan H
Bought by
Jason and Mccall Mary
Home Financials for this Owner
Home Financials are based on the most recent Mortgage that was taken out on this home.
Original Mortgage
$40,000
Interest Rate
7.94%
Mortgage Type
New Conventional
Create a Home Valuation Report for This Property
The Home Valuation Report is an in-depth analysis detailing your home's value as well as a comparison with similar homes in the area
Home Values in the Area
Average Home Value in this Area
Purchase History
| Date | Buyer | Sale Price | Title Company |
|---|---|---|---|
| Pixley Bruce L | -- | None Available | |
| Pikley Robert | -- | None Available | |
| Pixley Leisa G | $31,000 | Accommodation | |
| U S Bank Na | $50,000 | Public Square Title Agency L | |
| Jason | $40,000 | -- |
Source: Public Records
Mortgage History
| Date | Status | Borrower | Loan Amount |
|---|---|---|---|
| Previous Owner | Jason | $40,000 |
Source: Public Records
Tax History
| Year | Tax Paid | Tax Assessment Tax Assessment Total Assessment is a certain percentage of the fair market value that is determined by local assessors to be the total taxable value of land and additions on the property. | Land | Improvement |
|---|---|---|---|---|
| 2024 | $2,524 | $32,940 | $5,990 | $26,950 |
| 2023 | $1,321 | $32,940 | $5,990 | $26,950 |
| 2022 | $1,102 | $23,870 | $4,620 | $19,250 |
| 2021 | $1,113 | $23,870 | $4,620 | $19,250 |
| 2020 | $1,113 | $23,870 | $4,620 | $19,250 |
| 2019 | $1,120 | $23,280 | $4,730 | $18,550 |
| 2018 | $1,084 | $23,280 | $4,730 | $18,550 |
| 2017 | $1,076 | $23,280 | $4,730 | $18,550 |
| 2016 | $992 | $21,290 | $4,310 | $16,980 |
| 2015 | $2,053 | $21,780 | $4,800 | $16,980 |
| 2014 | $985 | $21,780 | $4,800 | $16,980 |
| 2013 | $2,152 | $23,320 | $3,820 | $19,500 |
Source: Public Records
Map
Nearby Homes
- 4775 School St
- 0 Weaver Rd Unit 11673543
- 3644 Plymouth Ridge Rd
- 5581 Hatches Corners Rd
- 5958 Weaver Rd
- 5024 Hilldom Rd
- 6231 Weaver Rd
- 0 Adams Rd Unit 5195086
- 0 Adams Rd Unit LotWP001
- 4132 Benetka Rd
- 0 Creek Rd Unit 5172426
- 0 Plymouth Gageville Rd Unit 5174776
- 2905 Shirley St
- 436 Keefus Rd
- 7002 Reed Rd
- Oh-7 Unit LoTWP001
- 7032 Reed Rd
- 7011 Richwood Dr
- 3241 S Forest Dr
- 6424 Walrath Cir
- 4850 State Rd
- 4641 Monroe Center Rd N
- 4876 State Rd
- 217 State Usr 20 St
- 4887 State Rd
- 4828 State Rd
- 4710 Monroe Center Rd N
- 4814 Monroe Center Rd N
- 4803 Stanhope Kelloggsville Rd
- 4715 Monroe Center Rd N
- 4716 Monroe Center Rd N
- 0 State Route 7 Unit 4349758
- VL State Route 7
- 0 State Route 7 Unit 4114263
- 4787 Stanhope Kelloggsville Rd
- 4713 Church St
- 4786 Church St
- 0 Monroe Center Unit 3273153
- 4725 Church St
- 4733 Church St
Your Personal Tour Guide
Ask me questions while you tour the home.