Estimated Value: $643,000 - $672,000
5
Beds
2
Baths
1,868
Sq Ft
$350/Sq Ft
Est. Value
About This Home
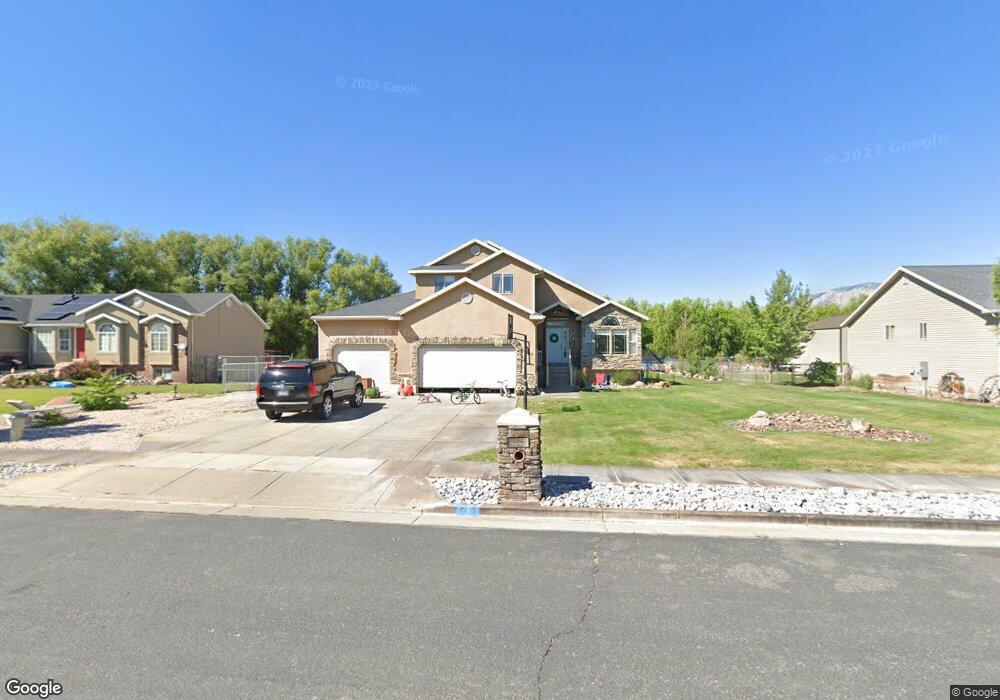
This home is located at 4862 W 1850 N Unit 11, Ogden, UT 84404 and is currently estimated at $653,774, approximately $349 per square foot. 4862 W 1850 N Unit 11 is a home located in Weber County with nearby schools including Plain City School, Wahlquist Junior High School, and Fremont High School.
Ownership History
Date
Name
Owned For
Owner Type
Purchase Details
Closed on
Sep 11, 2023
Sold by
Allen Cole J
Bought by
Allen Cole J and Allen Shaunalyn
Current Estimated Value
Purchase Details
Closed on
Nov 20, 2020
Sold by
Turner Kambree B and Turner Kambree B
Bought by
Allen Cole J
Home Financials for this Owner
Home Financials are based on the most recent Mortgage that was taken out on this home.
Original Mortgage
$374,800
Interest Rate
2.8%
Mortgage Type
New Conventional
Purchase Details
Closed on
Oct 13, 2017
Sold by
Nipko John and Nipko Kortney
Bought by
Turner Dalton C and Turner Kambree B
Home Financials for this Owner
Home Financials are based on the most recent Mortgage that was taken out on this home.
Original Mortgage
$304,000
Interest Rate
3.82%
Mortgage Type
New Conventional
Purchase Details
Closed on
Jun 29, 2012
Sold by
Nipko John and Nipko Kortney
Bought by
Nipko John and Nipko Kortney
Home Financials for this Owner
Home Financials are based on the most recent Mortgage that was taken out on this home.
Original Mortgage
$180,000
Interest Rate
3.74%
Mortgage Type
New Conventional
Purchase Details
Closed on
Apr 26, 2010
Sold by
Fish Reece D and Widodo Sarah
Bought by
Nipko John and Nipko Kortney
Purchase Details
Closed on
Aug 2, 2005
Sold by
Tiffany Development Lc
Bought by
Fish Reece D and Fish Sarah B
Purchase Details
Closed on
Nov 16, 2004
Sold by
Fish Reece D
Bought by
Fish Reece D and Fish Sarah L B
Home Financials for this Owner
Home Financials are based on the most recent Mortgage that was taken out on this home.
Original Mortgage
$50,000
Interest Rate
5.79%
Mortgage Type
Stand Alone First
Purchase Details
Closed on
Nov 15, 2004
Sold by
Zach Higley Construction Inc
Bought by
Fish Reece D
Home Financials for this Owner
Home Financials are based on the most recent Mortgage that was taken out on this home.
Original Mortgage
$50,000
Interest Rate
5.79%
Mortgage Type
Stand Alone First
Purchase Details
Closed on
Apr 28, 2004
Sold by
Tiffany Development Lc
Bought by
Zach Higley Construction Inc
Create a Home Valuation Report for This Property
The Home Valuation Report is an in-depth analysis detailing your home's value as well as a comparison with similar homes in the area
Home Values in the Area
Average Home Value in this Area
Purchase History
| Date | Buyer | Sale Price | Title Company |
|---|---|---|---|
| Allen Cole J | -- | Old Republic Title | |
| Allen Cole J | -- | Metro National Title | |
| Turner Dalton C | -- | Stewart Title Ins Agency Of | |
| Nipko John | -- | U S Title Insurance Agency | |
| Nipko John | -- | Utah Commercial Title | |
| Fish Reece D | -- | Founders Title | |
| Fish Reece D | -- | -- | |
| Fish Reece D | -- | Heritage West Title Insuranc | |
| Zach Higley Construction Inc | -- | Founders Title |
Source: Public Records
Mortgage History
| Date | Status | Borrower | Loan Amount |
|---|---|---|---|
| Previous Owner | Allen Cole J | $374,800 | |
| Previous Owner | Turner Dalton C | $304,000 | |
| Previous Owner | Nipko John | $180,000 | |
| Previous Owner | Fish Reece D | $50,000 |
Source: Public Records
Tax History Compared to Growth
Tax History
| Year | Tax Paid | Tax Assessment Tax Assessment Total Assessment is a certain percentage of the fair market value that is determined by local assessors to be the total taxable value of land and additions on the property. | Land | Improvement |
|---|---|---|---|---|
| 2025 | $2,804 | $582,822 | $180,000 | $402,822 |
| 2024 | $2,679 | $315,149 | $99,001 | $216,148 |
| 2023 | $2,847 | $331,650 | $98,935 | $232,715 |
| 2022 | $2,766 | $326,700 | $88,002 | $238,698 |
| 2021 | $2,148 | $431,000 | $95,044 | $335,956 |
| 2020 | $1,987 | $368,000 | $70,010 | $297,990 |
| 2019 | $2,013 | $353,000 | $65,011 | $287,989 |
| 2018 | $1,877 | $315,000 | $65,011 | $249,989 |
| 2017 | $1,887 | $302,000 | $63,000 | $239,000 |
| 2016 | $1,898 | $166,106 | $38,174 | $127,932 |
| 2015 | $1,508 | $129,391 | $32,719 | $96,672 |
| 2014 | $1,380 | $116,782 | $32,719 | $84,063 |
Source: Public Records
Map
Nearby Homes
- 1980 N 4650 W
- 2131 N 4650 W
- 1885 N 4475 W
- 4494 W 1600 N
- 4227 W Pioneer Rd
- 4370 W 1500 N
- 4210 W 1975 N
- 1239 N 4925 W
- 1221 N 4975 W
- 1748 N 4100 St W
- 2416 N 4275 W
- 3966 W 2200 N
- 2834 N 5150 W
- 3622 W 2200 St N Unit 23
- 2700 N 4200 W
- 2793 W 2775 N
- 2797 W 2775 N Unit 129
- 2782 W 2775 N Unit 105
- 2792 W 2775 N Unit 103
- 4212 W 1975 N
- 4862 W 1850 N
- 4854 W 1850 N
- 4854 W 1850 N Unit 10
- 4870 W 1850 N
- 4870 W 1850 N Unit 12
- 4863 W 1850 N
- 4863 W 1850 N Unit 13
- 4832 W 1850 N
- 4832 W 1850 N Unit 9
- 1831 N 4850 W
- 4808 W 1850 N
- 4808 W 1850 N Unit 8
- 1820 N 4850 W
- 1820 N 4850 W Unit 19
- 1805 N 4850 W
- 1805 N 4850 W Unit 14
- 4794 W 1850 N
- 4794 W 1850 N Unit 7
- 4805 W 1850 N
- 4805 W 1850 N Unit 20