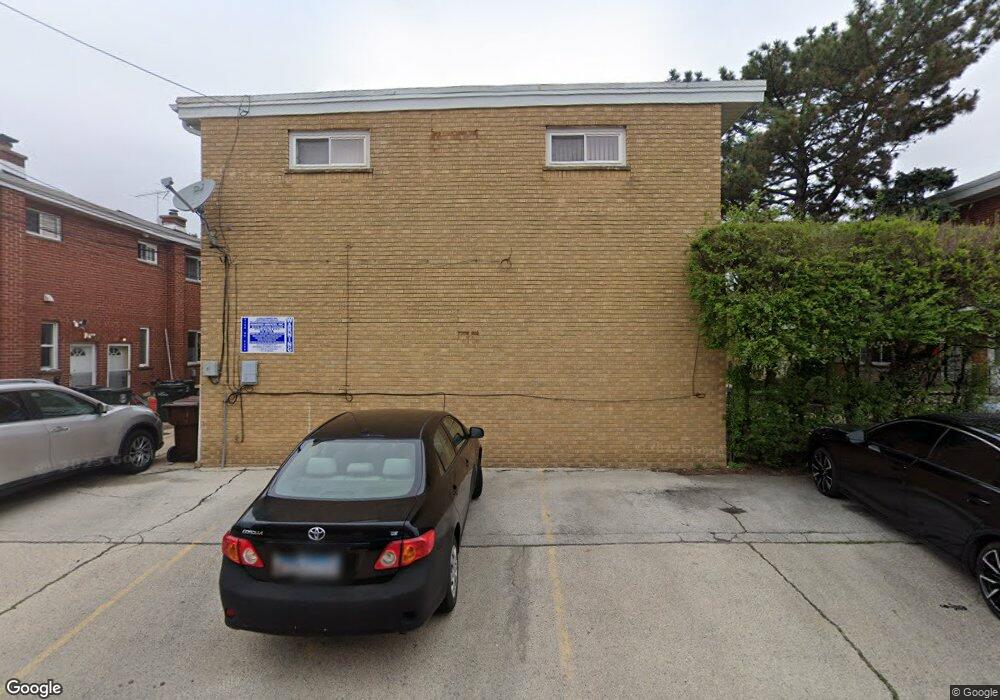
4863 Enfield Ave Skokie, IL 60077
Southwest Skokie NeighborhoodEstimated Value: $303,000 - $378,000
2
Beds
2
Baths
1,060
Sq Ft
$318/Sq Ft
Est. Value
About This Home
This home is located at 4863 Enfield Ave, Skokie, IL 60077 and is currently estimated at $336,753, approximately $317 per square foot. 4863 Enfield Ave is a home located in Cook County with nearby schools including Old Orchard Jr High School, Jane Stenson School, and Niles North High School.
Ownership History
Date
Name
Owned For
Owner Type
Purchase Details
Closed on
Jun 22, 2021
Sold by
Your Estate Llc
Bought by
Chaudhry Imrana and Choudhary Rashad
Current Estimated Value
Home Financials for this Owner
Home Financials are based on the most recent Mortgage that was taken out on this home.
Original Mortgage
$196,000
Outstanding Balance
$178,056
Interest Rate
3.12%
Mortgage Type
New Conventional
Estimated Equity
$158,697
Purchase Details
Closed on
Jun 2, 2016
Sold by
Galinski Irene
Bought by
Your Estate Llc
Purchase Details
Closed on
Mar 28, 2003
Sold by
Kupriyanov Vladimir and Kupriyanov Yelena
Bought by
Galinsky Irene
Home Financials for this Owner
Home Financials are based on the most recent Mortgage that was taken out on this home.
Original Mortgage
$221,523
Interest Rate
5.94%
Mortgage Type
FHA
Purchase Details
Closed on
Apr 30, 1997
Sold by
Lam Yau Wah
Bought by
Kupriyanov Vladimir and Kupriyanova Yelena
Create a Home Valuation Report for This Property
The Home Valuation Report is an in-depth analysis detailing your home's value as well as a comparison with similar homes in the area
Home Values in the Area
Average Home Value in this Area
Purchase History
| Date | Buyer | Sale Price | Title Company |
|---|---|---|---|
| Chaudhry Imrana | $245,000 | Cambridge Title Company | |
| Your Estate Llc | $184,800 | Regency Title Services Inc | |
| Galinsky Irene | $225,000 | Stewart Title | |
| Kupriyanov Vladimir | $120,000 | -- |
Source: Public Records
Mortgage History
| Date | Status | Borrower | Loan Amount |
|---|---|---|---|
| Open | Chaudhry Imrana | $196,000 | |
| Previous Owner | Galinsky Irene | $221,523 |
Source: Public Records
Tax History Compared to Growth
Tax History
| Year | Tax Paid | Tax Assessment Tax Assessment Total Assessment is a certain percentage of the fair market value that is determined by local assessors to be the total taxable value of land and additions on the property. | Land | Improvement |
|---|---|---|---|---|
| 2024 | $5,247 | $21,000 | $4,000 | $17,000 |
| 2023 | $5,106 | $21,000 | $4,000 | $17,000 |
| 2022 | $5,106 | $21,000 | $4,000 | $17,000 |
| 2021 | $4,692 | $17,144 | $1,000 | $16,144 |
| 2020 | $4,646 | $17,144 | $1,000 | $16,144 |
| 2019 | $4,746 | $19,263 | $1,000 | $18,263 |
| 2018 | $4,732 | $17,564 | $906 | $16,658 |
| 2017 | $4,766 | $17,564 | $906 | $16,658 |
| 2016 | $3,909 | $17,564 | $906 | $16,658 |
| 2015 | $3,526 | $15,257 | $781 | $14,476 |
| 2014 | $3,459 | $15,257 | $781 | $14,476 |
| 2013 | $3,435 | $15,257 | $781 | $14,476 |
Source: Public Records
Map
Nearby Homes
- 8836 Bronx Ave
- 8847 La Crosse Ave Unit 204
- 8914 La Crosse Ave Unit 2S
- 4901 Carol Unit F St
- 8940 Lamon Ave
- 8710 Skokie Blvd Unit 3BS
- 4801 Grove St
- 8644 Skokie Blvd
- 9011 Bronx Ave
- 4820 Conrad St Unit 101
- 9012 Lamon Ave
- 4735 Grove St Unit 103
- 5128 Suffield Ct
- 8534 Terminal Ave
- 8524 Skokie Blvd Unit 3E
- 8500 Skokie Blvd Unit 3A
- 8717 Gross Point Rd
- 5109 Greenleaf St
- 4949 Church St Unit 107
- 8605 Laramie Ave
- 4863 Enfield Ave
- 4863 Enfield Ave
- 4863 Enfield Ave
- 4863 Enfield Ave Unit C
- 4863 Enfield Ave Unit B
- 4857 Enfield Ave Unit B
- 4857 Enfield Ave
- 4857 Enfield Ave
- 4857 Enfield Ave
- 4857 Enfield Ave
- 4857 Enfield Ave Unit D
- 4857 Enfield Ave Unit C
- 4903 Enfield Ave
- 4903 Enfield Ave
- 4903 Enfield Ave
- 4903 Enfield Ave
- 4903 Enfield Ave Unit D
- 4903 Enfield Ave Unit B
- 4903 Enfield Ave Unit C
- 4853 Enfield Ave Unit A