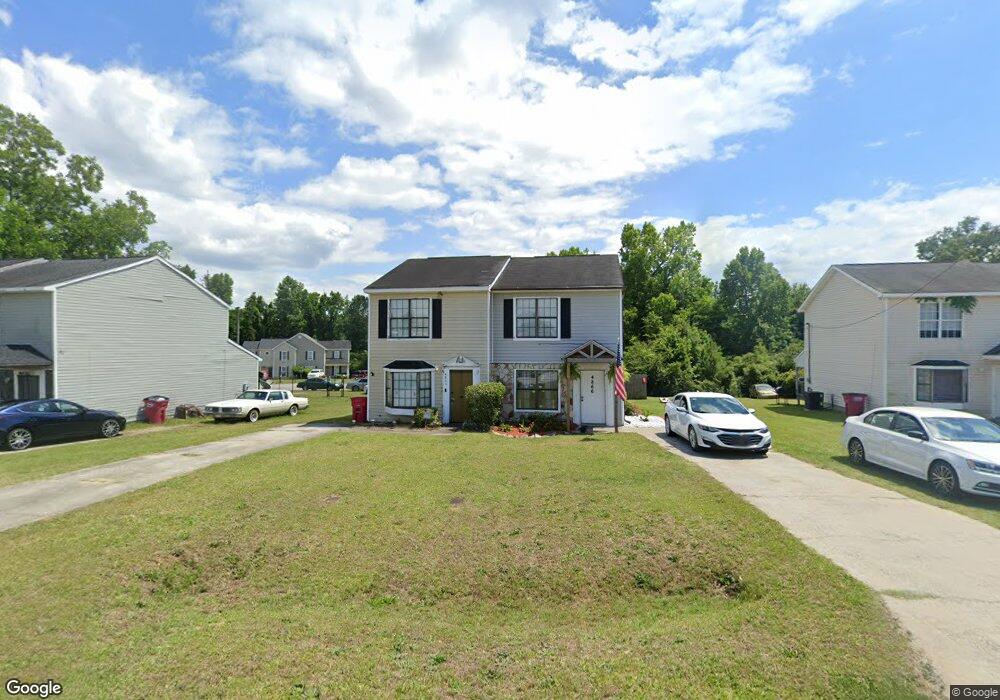
4864 Mamie Carter Dr Macon, GA 31210
Estimated Value: $68,000 - $93,000
2
Beds
2
Baths
964
Sq Ft
$81/Sq Ft
Est. Value
About This Home
This home is located at 4864 Mamie Carter Dr, Macon, GA 31210 and is currently estimated at $77,953, approximately $80 per square foot. 4864 Mamie Carter Dr is a home located in Bibb County with nearby schools including Union Elementary School, Weaver Middle School, and Westside High School.
Ownership History
Date
Name
Owned For
Owner Type
Purchase Details
Closed on
Jul 21, 2025
Sold by
Selby Desia L and Bacon Desia L
Bought by
Ashanti Douglas and Zenova Torney Zenova
Current Estimated Value
Home Financials for this Owner
Home Financials are based on the most recent Mortgage that was taken out on this home.
Original Mortgage
$54,843
Outstanding Balance
$54,747
Interest Rate
6.67%
Mortgage Type
FHA
Estimated Equity
$23,206
Purchase Details
Closed on
Jan 26, 2005
Sold by
Kemper M Larry and Kemper Kathryn K
Bought by
Bacon Desia L
Home Financials for this Owner
Home Financials are based on the most recent Mortgage that was taken out on this home.
Original Mortgage
$39,750
Interest Rate
5.66%
Mortgage Type
New Conventional
Purchase Details
Closed on
Jan 31, 2003
Purchase Details
Closed on
Dec 31, 2002
Create a Home Valuation Report for This Property
The Home Valuation Report is an in-depth analysis detailing your home's value as well as a comparison with similar homes in the area
Home Values in the Area
Average Home Value in this Area
Purchase History
| Date | Buyer | Sale Price | Title Company |
|---|---|---|---|
| Ashanti Douglas | $65,000 | None Listed On Document | |
| Ashanti Douglas | $65,000 | None Listed On Document | |
| Bacon Desia L | $39,800 | None Available | |
| -- | $39,600 | -- | |
| -- | $39,500 | -- |
Source: Public Records
Mortgage History
| Date | Status | Borrower | Loan Amount |
|---|---|---|---|
| Open | Ashanti Douglas | $54,843 | |
| Closed | Ashanti Douglas | $54,843 | |
| Previous Owner | Bacon Desia L | $39,750 |
Source: Public Records
Tax History Compared to Growth
Tax History
| Year | Tax Paid | Tax Assessment Tax Assessment Total Assessment is a certain percentage of the fair market value that is determined by local assessors to be the total taxable value of land and additions on the property. | Land | Improvement |
|---|---|---|---|---|
| 2025 | $521 | $21,220 | $480 | $20,740 |
| 2024 | $539 | $21,220 | $480 | $20,740 |
| 2023 | $539 | $21,220 | $480 | $20,740 |
| 2022 | $651 | $18,813 | $2,779 | $16,034 |
| 2021 | $449 | $18,813 | $2,779 | $16,034 |
| 2020 | $459 | $18,813 | $2,779 | $16,034 |
| 2019 | $462 | $18,813 | $2,779 | $16,034 |
| 2018 | $888 | $18,813 | $2,779 | $16,034 |
| 2017 | $443 | $18,813 | $2,779 | $16,034 |
| 2016 | $409 | $18,813 | $2,779 | $16,034 |
| 2015 | $579 | $18,813 | $2,779 | $16,034 |
| 2014 | $580 | $18,813 | $2,779 | $16,034 |
Source: Public Records
Map
Nearby Homes
- 4862 Mamie Carter Dr
- 4866 Mamie Carter Dr
- 104 W Oak Manor Ct
- 4860 Mamie Carter Dr
- 4868 Mamie Carter Dr
- 106 W Oak Manor Ct
- 4870 Mamie Carter Dr
- 108 W Oak Manor Ct
- 0 W Oak Manor Ct
- W W Oak Manor Ct
- 4842 Mamie Carter Dr
- 4880 Mamie Carter Dr
- 3793 Woodfield Dr
- 4840 Mamie Carter Dr
- 4840 Mamie Carter Dr Unit 8A
- 3791 Woodfield Dr
- 0 Woodfield Dr
- 101 W Oak Manor Ct
- 103 W Oak Manor Ct
- 112 W Oak Manor Ct