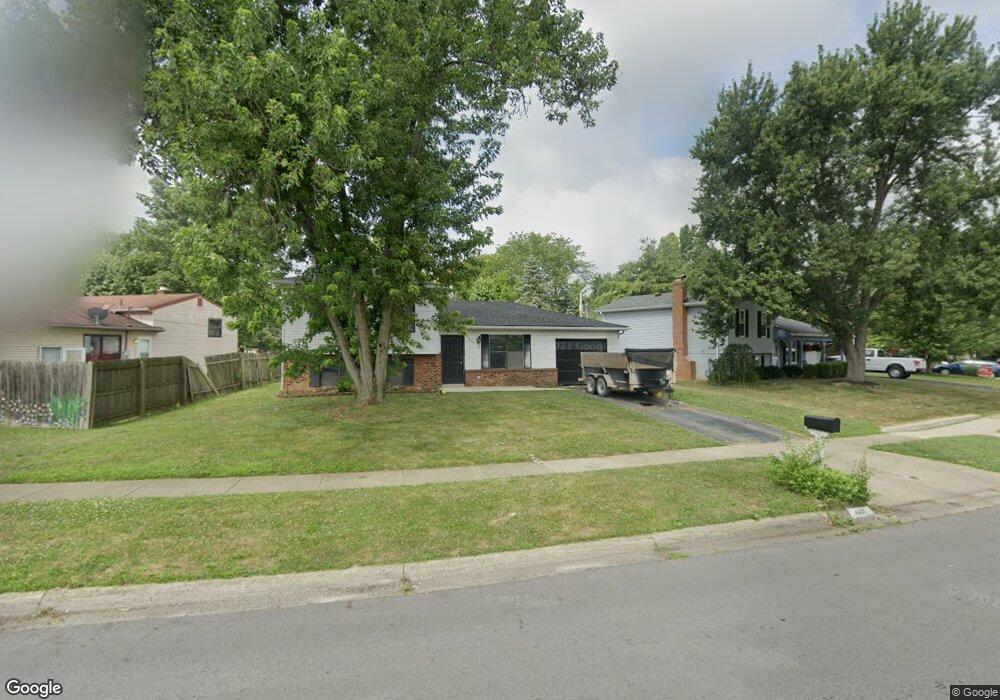
4865 Heaton Rd Columbus, OH 43229
Forest Park East NeighborhoodEstimated Value: $227,520 - $260,000
3
Beds
2
Baths
974
Sq Ft
$254/Sq Ft
Est. Value
About This Home
This home is located at 4865 Heaton Rd, Columbus, OH 43229 and is currently estimated at $247,880, approximately $254 per square foot. 4865 Heaton Rd is a home located in Franklin County with nearby schools including Northtowne Elementary School, Woodward Park Middle School, and Northland High School.
Ownership History
Date
Name
Owned For
Owner Type
Purchase Details
Closed on
May 3, 2013
Sold by
Martom Properties 10 Llc
Bought by
2013 A Property Holdings Llc
Current Estimated Value
Purchase Details
Closed on
May 9, 2005
Sold by
Martom Properties Llc
Bought by
Martom Properties 10 Llc
Purchase Details
Closed on
Feb 6, 2004
Sold by
Pratt Mark S and Pratt Kayla
Bought by
Martom Properties Llc
Home Financials for this Owner
Home Financials are based on the most recent Mortgage that was taken out on this home.
Original Mortgage
$92,000
Interest Rate
5.77%
Mortgage Type
Purchase Money Mortgage
Purchase Details
Closed on
Jun 4, 2001
Sold by
Baldwin Lisa J and The Leader Mortgage Co
Bought by
Pratt Mark S and Smith Thomas
Purchase Details
Closed on
Oct 11, 1990
Bought by
Baldwin Lisa J
Purchase Details
Closed on
Jan 1, 1987
Purchase Details
Closed on
Jun 1, 1983
Create a Home Valuation Report for This Property
The Home Valuation Report is an in-depth analysis detailing your home's value as well as a comparison with similar homes in the area
Home Values in the Area
Average Home Value in this Area
Purchase History
| Date | Buyer | Sale Price | Title Company |
|---|---|---|---|
| 2013 A Property Holdings Llc | $82,900 | Indspendent Title Box | |
| Martom Properties 10 Llc | -- | -- | |
| Martom Properties Llc | -- | Capcity Title | |
| Pratt Mark S | $86,800 | -- | |
| Baldwin Lisa J | $73,900 | -- | |
| -- | $60,200 | -- | |
| -- | -- | -- |
Source: Public Records
Mortgage History
| Date | Status | Borrower | Loan Amount |
|---|---|---|---|
| Previous Owner | Martom Properties Llc | $92,000 |
Source: Public Records
Tax History
| Year | Tax Paid | Tax Assessment Tax Assessment Total Assessment is a certain percentage of the fair market value that is determined by local assessors to be the total taxable value of land and additions on the property. | Land | Improvement |
|---|---|---|---|---|
| 2025 | $2,992 | $65,280 | $20,130 | $45,150 |
| 2024 | $2,992 | $65,280 | $20,130 | $45,150 |
| 2023 | $2,954 | $65,280 | $20,130 | $45,150 |
| 2022 | $2,718 | $51,140 | $8,680 | $42,460 |
| 2021 | $2,723 | $51,140 | $8,680 | $42,460 |
| 2020 | $2,727 | $51,140 | $8,680 | $42,460 |
| 2019 | $3,426 | $51,140 | $8,680 | $42,460 |
| 2018 | $1,996 | $35,390 | $8,680 | $26,710 |
| 2017 | $2,086 | $35,390 | $8,680 | $26,710 |
| 2016 | $1,972 | $29,020 | $8,160 | $20,860 |
| 2015 | $1,795 | $29,020 | $8,160 | $20,860 |
| 2014 | $1,969 | $31,750 | $8,160 | $23,590 |
| 2013 | $1,021 | $33,390 | $8,575 | $24,815 |
Source: Public Records
Map
Nearby Homes
- 1905 Denise Dr
- 4979 Lyle Rd
- 4885 Northtowne Blvd
- 4852 Snowbird Cir Unit 13B
- 1685 Norma Rd
- 2177 Margo Rd
- 2251 Tuliptree Ave
- 4923 Karl Rd Unit 4925
- 4909-4911 Karl Rd
- 5004 Julie Place
- 5010 Julie Place
- 1485 Norma Rd
- 4795 Colonel Perry Dr
- 1638 Arrowood Loop N
- 2087 Teakwood Dr
- 5352 Hazelwood Rd
- 1862 Torchwood Dr
- 0 Chester Rd
- 5486 Pine Bluff Rd
- 0 Abington Rd Unit 225045775
- 4877 Heaton Rd
- 1952 Dandridge Dr
- 1940 Dandridge Dr
- 1939 Coghill Dr
- 1928 Dandridge Dr
- 1963 Brittany Rd
- 1927 Coghill Dr
- 4860 Heaton Rd
- 4852 Heaton Rd
- 4844 Heaton Rd
- 4829 Heaton Rd
- 1945 Dandridge Dr
- 1944 Coghill Dr
- 1920 Dandridge Dr
- 1919 Coghill Dr
- 1937 Dandridge Dr
- 4836 Heaton Rd
- 1975 Brittany Rd
- 1929 Dandridge Dr
- 4895 Dunlap Rd
Your Personal Tour Guide
Ask me questions while you tour the home.