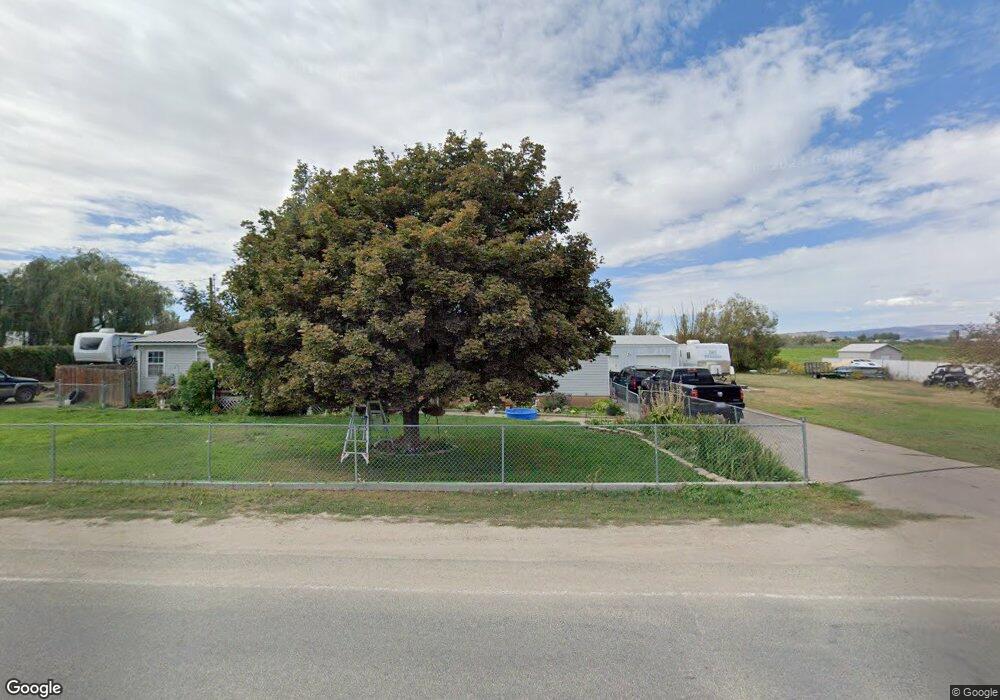
4866 S 2500 E Vernal, UT 84078
Estimated Value: $307,000 - $494,000
4
Beds
3
Baths
2,052
Sq Ft
$194/Sq Ft
Est. Value
About This Home
This home is located at 4866 S 2500 E, Vernal, UT 84078 and is currently estimated at $398,488, approximately $194 per square foot. 4866 S 2500 E is a home located in Uintah County with nearby schools including Davis School, Vernal Middle School, and Uintah Middle School.
Ownership History
Date
Name
Owned For
Owner Type
Purchase Details
Closed on
Aug 28, 2007
Sold by
Morrill Brock S and Morrill Wendy M
Bought by
Haskins Christopher
Current Estimated Value
Home Financials for this Owner
Home Financials are based on the most recent Mortgage that was taken out on this home.
Original Mortgage
$197,894
Outstanding Balance
$126,380
Interest Rate
6.74%
Mortgage Type
FHA
Estimated Equity
$272,108
Purchase Details
Closed on
Aug 27, 2007
Sold by
Noyes Garth F and Noyes Connie W
Bought by
Morrill Brock S and Morrill Wendy M
Home Financials for this Owner
Home Financials are based on the most recent Mortgage that was taken out on this home.
Original Mortgage
$197,894
Outstanding Balance
$126,380
Interest Rate
6.74%
Mortgage Type
FHA
Estimated Equity
$272,108
Purchase Details
Closed on
Mar 31, 2005
Sold by
Cowley Glen M and Cowley Karen S
Bought by
Morrill Brock S and Morrill Wendy M
Home Financials for this Owner
Home Financials are based on the most recent Mortgage that was taken out on this home.
Original Mortgage
$132,126
Interest Rate
5.77%
Mortgage Type
FHA
Create a Home Valuation Report for This Property
The Home Valuation Report is an in-depth analysis detailing your home's value as well as a comparison with similar homes in the area
Purchase History
| Date | Buyer | Sale Price | Title Company |
|---|---|---|---|
| Haskins Christopher | -- | -- | |
| Morrill Brock S | -- | -- | |
| Morrill Brock S | -- | -- |
Source: Public Records
Mortgage History
| Date | Status | Borrower | Loan Amount |
|---|---|---|---|
| Open | Haskins Christopher | $197,894 | |
| Closed | Morrill Brock S | $197,894 | |
| Previous Owner | Morrill Brock S | $132,126 |
Source: Public Records
Tax History
| Year | Tax Paid | Tax Assessment Tax Assessment Total Assessment is a certain percentage of the fair market value that is determined by local assessors to be the total taxable value of land and additions on the property. | Land | Improvement |
|---|---|---|---|---|
| 2024 | $1,911 | $225,538 | $16,440 | $209,098 |
| 2023 | $1,895 | $160,646 | $16,440 | $144,206 |
| 2022 | $1,264 | $122,473 | $16,440 | $106,033 |
| 2021 | $1,336 | $106,299 | $16,440 | $89,859 |
| 2020 | $1,068 | $87,243 | $13,750 | $73,493 |
| 2019 | $1,021 | $82,435 | $13,750 | $68,685 |
| 2018 | $979 | $79,164 | $13,750 | $65,414 |
| 2017 | $10 | $79,164 | $13,750 | $65,414 |
| 2016 | $1,032 | $91,623 | $13,750 | $77,873 |
| 2015 | $954 | $91,944 | $16,500 | $75,444 |
| 2014 | $943 | $91,944 | $16,500 | $75,444 |
| 2013 | $964 | $91,944 | $16,500 | $75,444 |
Source: Public Records
Map
Nearby Homes
- 4977 S 2625 E
- 4361 S 2280 E
- 1801 E 4500 S
- 2658 E 3950 S
- 2636 E 3950 S
- 3340 E 5000 S
- 3447 E 5300 S
- 5600 S 1500 E
- 1676 E 4000 S
- 2101 E Goose Ranch Rd
- 3541 U S Highway 40
- 2308 E Highway 40
- 3998 E 5000 S
- 1435 E 5975 S Unit 14
- 3310 S 2500 E
- 3311 E 3500 S Unit 3
- 3331 E 3500 S Unit 4
- 3955 4000 East St
- 4111 E 4000 S
- 3203 S 4000 E
Your Personal Tour Guide
Ask me questions while you tour the home.