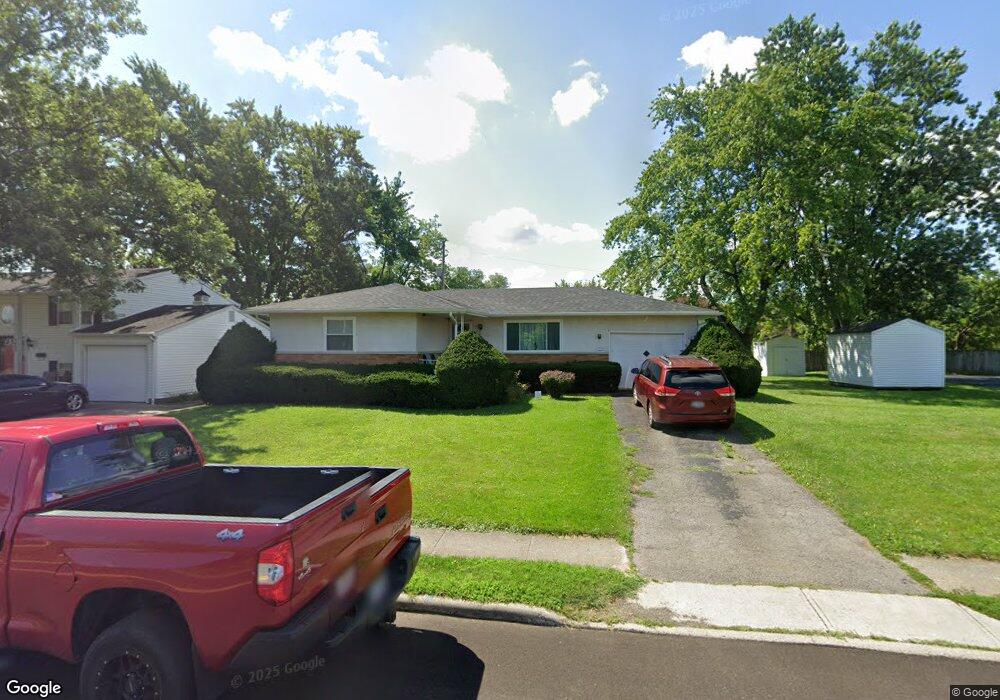
4867 Amesbury Way Columbus, OH 43228
Estimated Value: $207,000 - $242,000
3
Beds
1
Bath
1,185
Sq Ft
$189/Sq Ft
Est. Value
About This Home
This home is located at 4867 Amesbury Way, Columbus, OH 43228 and is currently estimated at $224,376, approximately $189 per square foot. 4867 Amesbury Way is a home located in Franklin County with nearby schools including Prairie Lincoln Elementary School, Galloway Ridge Intermediate School, and Norton Middle School.
Ownership History
Date
Name
Owned For
Owner Type
Purchase Details
Closed on
Sep 15, 2008
Sold by
Hud
Bought by
Ross Anna M
Current Estimated Value
Home Financials for this Owner
Home Financials are based on the most recent Mortgage that was taken out on this home.
Original Mortgage
$87,085
Outstanding Balance
$58,007
Interest Rate
6.55%
Mortgage Type
FHA
Estimated Equity
$166,369
Purchase Details
Closed on
May 22, 2008
Sold by
Lanzer Mark A and Fort Worth Mortgage
Bought by
Hud
Purchase Details
Closed on
Sep 4, 1996
Sold by
Armstrong Ralph G
Bought by
Lanzer Mark A and Lanzer Melissa B
Home Financials for this Owner
Home Financials are based on the most recent Mortgage that was taken out on this home.
Original Mortgage
$87,117
Interest Rate
8.27%
Mortgage Type
FHA
Purchase Details
Closed on
Feb 1, 1985
Create a Home Valuation Report for This Property
The Home Valuation Report is an in-depth analysis detailing your home's value as well as a comparison with similar homes in the area
Home Values in the Area
Average Home Value in this Area
Purchase History
| Date | Buyer | Sale Price | Title Company |
|---|---|---|---|
| Ross Anna M | $85,000 | Peak | |
| Hud | $76,000 | None Available | |
| Lanzer Mark A | $89,000 | -- | |
| -- | -- | -- |
Source: Public Records
Mortgage History
| Date | Status | Borrower | Loan Amount |
|---|---|---|---|
| Open | Ross Anna M | $87,085 | |
| Previous Owner | Lanzer Mark A | $87,117 |
Source: Public Records
Tax History Compared to Growth
Tax History
| Year | Tax Paid | Tax Assessment Tax Assessment Total Assessment is a certain percentage of the fair market value that is determined by local assessors to be the total taxable value of land and additions on the property. | Land | Improvement |
|---|---|---|---|---|
| 2024 | $3,105 | $68,150 | $17,220 | $50,930 |
| 2023 | $2,972 | $68,145 | $17,220 | $50,925 |
| 2022 | $2,209 | $35,390 | $3,820 | $31,570 |
| 2021 | $2,244 | $35,390 | $3,820 | $31,570 |
| 2020 | $2,223 | $35,390 | $3,820 | $31,570 |
| 2019 | $2,173 | $30,210 | $3,190 | $27,020 |
| 2018 | $2,262 | $30,210 | $3,190 | $27,020 |
| 2017 | $2,051 | $30,210 | $3,190 | $27,020 |
| 2016 | $2,357 | $31,780 | $6,370 | $25,410 |
| 2015 | $2,357 | $31,780 | $6,370 | $25,410 |
| 2014 | $2,323 | $31,780 | $6,370 | $25,410 |
| 2013 | $1,365 | $37,380 | $7,490 | $29,890 |
Source: Public Records
Map
Nearby Homes
- 316 Sturbridge Rd
- 141 Beacon Run W Unit 26E
- 87 Tarryton Ct W Unit 18D
- 271 Carilla Ln
- 4696 Tarryton Ct S Unit 7-2D
- 218 Darbyhurst Rd
- 74 Tarryton Ct E Unit 10A
- 4589 Annhurst Rd
- 89 Postle Blvd
- 450 Lawrence Ave
- 1518 Forbes Ave
- 4637 Hilton Ave
- 264 Woodlawn Ave
- 299 Lombard Rd
- 5409 Longworth Dr
- 5504 Inglecrest Place
- 212 Charing Cross St
- 429 Postle Blvd
- 4778 Hafey Ave
- 5006 Old Tree Ave
- 4859 Amesbury Way
- 4851 Amesbury Way
- 4858 Taunton Way
- 4870 Taunton Way
- 4850 Taunton Way
- 4843 Amesbury Way
- 4842 Taunton Way
- 4833 Amesbury Way
- 4834 Taunton Way
- 4863 Taunton Way
- 4855 Taunton Way
- 4871 Taunton Way
- 4826 Taunton Way
- 4849 Taunton Way
- 4881 Taunton Way
- 4841 Taunton Way
- 4822 Taunton Way
- 4823 Amesbury Way
- 245 N Murray Hill Rd
- 275 N Murray Hill Rd