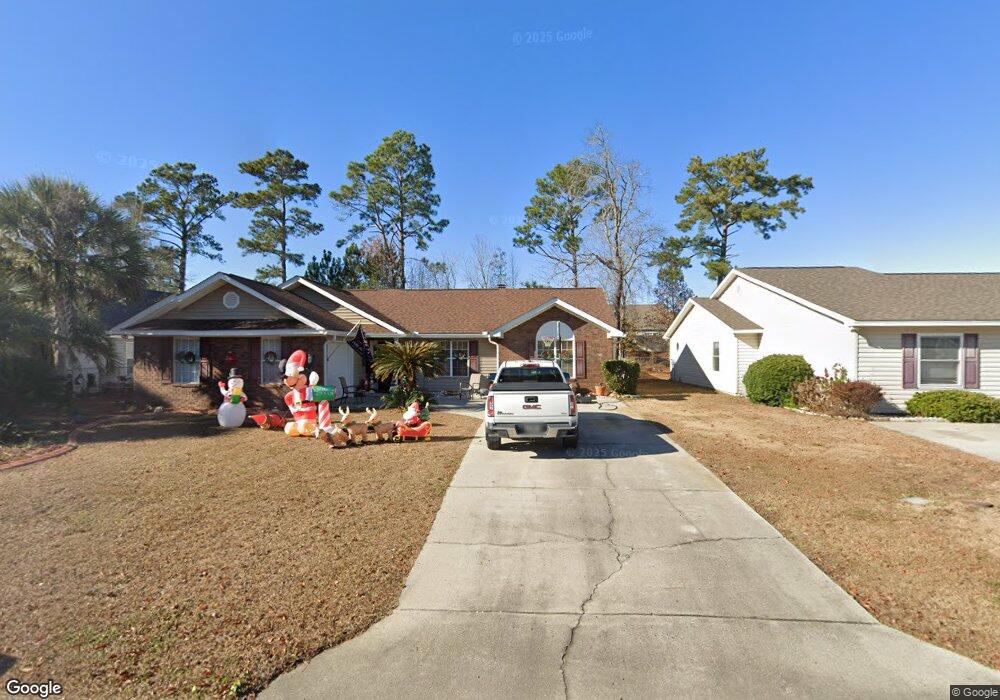
4867 Right End Ct Myrtle Beach, SC 29579
Estimated Value: $250,000 - $282,000
3
Beds
2
Baths
1,349
Sq Ft
$195/Sq Ft
Est. Value
About This Home
This home is located at 4867 Right End Ct, Myrtle Beach, SC 29579 and is currently estimated at $263,271, approximately $195 per square foot. 4867 Right End Ct is a home located in Horry County with nearby schools including Forestbrook Elementary School, Forestbrook Middle School, and Socastee High School.
Ownership History
Date
Name
Owned For
Owner Type
Purchase Details
Closed on
Apr 29, 2016
Sold by
Scott G Johnson
Bought by
Murrell Joe and Murrell Pamela
Current Estimated Value
Home Financials for this Owner
Home Financials are based on the most recent Mortgage that was taken out on this home.
Original Mortgage
$80,000
Outstanding Balance
$63,686
Interest Rate
3.66%
Estimated Equity
$199,585
Purchase Details
Closed on
May 15, 2003
Sold by
Joyner Robert L and Joyner Lynda P
Bought by
Murrell Joe D and Murrell Pamela R
Home Financials for this Owner
Home Financials are based on the most recent Mortgage that was taken out on this home.
Original Mortgage
$115,050
Interest Rate
5.79%
Mortgage Type
FHA
Purchase Details
Closed on
Jun 11, 1999
Sold by
Mishoe Stephanie
Bought by
Joyner Robert L and Joyner Lynda P
Home Financials for this Owner
Home Financials are based on the most recent Mortgage that was taken out on this home.
Original Mortgage
$98,500
Interest Rate
6.5%
Mortgage Type
Purchase Money Mortgage
Create a Home Valuation Report for This Property
The Home Valuation Report is an in-depth analysis detailing your home's value as well as a comparison with similar homes in the area
Home Values in the Area
Average Home Value in this Area
Purchase History
| Date | Buyer | Sale Price | Title Company |
|---|---|---|---|
| Murrell Joe | -- | -- | |
| Murrell Joe D | $116,900 | -- | |
| Joyner Robert L | $107,000 | -- |
Source: Public Records
Mortgage History
| Date | Status | Borrower | Loan Amount |
|---|---|---|---|
| Open | Murrell Joe | $80,000 | |
| Closed | Murrell Joe | -- | |
| Previous Owner | Murrell Joe D | $115,050 | |
| Previous Owner | Joyner Robert L | $98,500 |
Source: Public Records
Tax History Compared to Growth
Tax History
| Year | Tax Paid | Tax Assessment Tax Assessment Total Assessment is a certain percentage of the fair market value that is determined by local assessors to be the total taxable value of land and additions on the property. | Land | Improvement |
|---|---|---|---|---|
| 2024 | $574 | $9,842 | $3,415 | $6,427 |
| 2023 | $574 | $4,584 | $982 | $3,602 |
| 2021 | $523 | $6,104 | $1,124 | $4,980 |
| 2020 | $443 | $6,104 | $1,124 | $4,980 |
| 2019 | $443 | $6,104 | $1,124 | $4,980 |
| 2018 | $402 | $3,986 | $854 | $3,132 |
| 2017 | $387 | $3,986 | $854 | $3,132 |
| 2016 | -- | $3,986 | $854 | $3,132 |
| 2015 | $387 | $3,986 | $854 | $3,132 |
| 2014 | $357 | $3,986 | $854 | $3,132 |
Source: Public Records
Map
Nearby Homes
- 4070 Halyard Way Unit MB
- 377 Vintage Cir
- 4059 Long Line Ln
- 4380 Livorn Loop Unit 4380
- 4368 Livorn Loop Unit 4368
- 336 Vintage Cir
- 5344 Grosseto Way
- 4348 Livorn Loop Unit 4348
- 4258 Summit Trail
- 4246 Livorn Loop
- 4280 Hunting Bow Trail
- 746 Gumbo Limbo Ln
- 4336 Summit Trail Unit MB
- 950 Forestbrook Rd Unit C-3
- 817 Arezzo Way Unit 1001 - Brookhaven
- 5048 Prato Loop Unit 5048
- 3334 Volterra Way Unit 3334
- 4535 Tarpon Bay Rd
- 875 Brookline Dr
- 5231 Casentino Ct
- 4863 Right End Ct
- 4863 Right End Ct Unit Pine Ridge
- 4875 Right End Ct
- 4859 Right End Ct
- 4504 Livorn Loop Unit Savona Lot 7
- 4504 Livorn Loop Unit 7
- 4508 Livorn Loop Unit Savona Lot 6
- 4508 Livorn Loop Unit 6
- 4500 Livorn Loop Unit Savona Lot 8
- 4500 Livorn Loop Unit 8
- 4512 Livorn Loop Unit Savona 5
- 4512 Livorn Loop Unit 5
- 4496 Livorn Loop Unit Savona Lot 9
- 4496 Livorn Loop Unit Savona-Tuscany
- 4496 Livorn Loop
- 4496 Livorn Loop Unit 4496
- 4496 Livorn Loop Unit 9
- 4516 Livorn Loop Unit 4
- 4870 Right End Ct
- 4492 Livorn Loop Unit Savona Lot 10