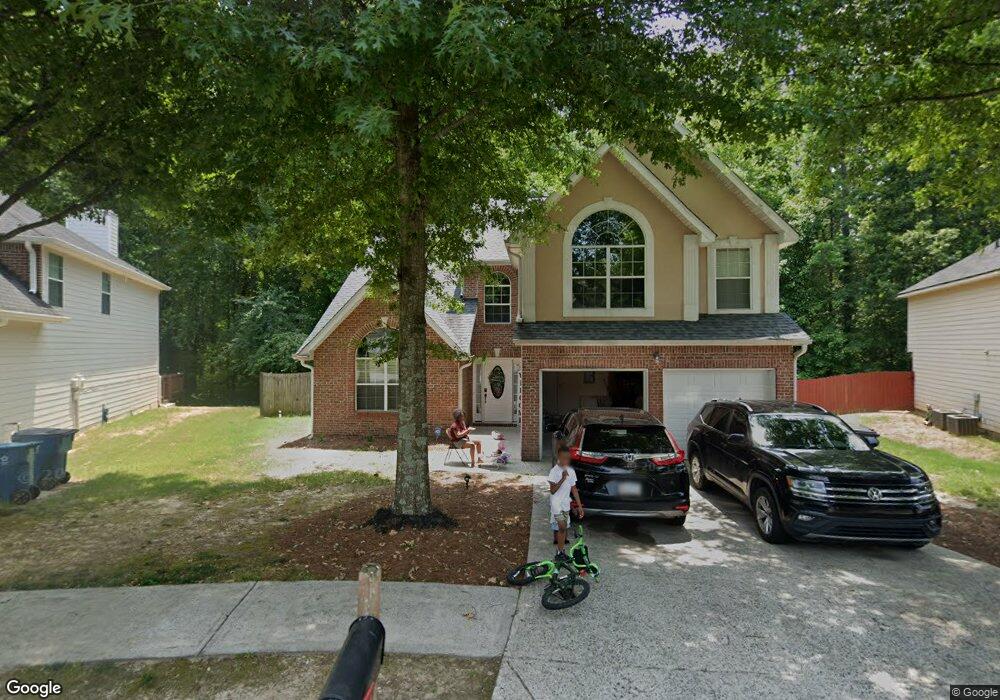
4869 Lily Stem Dr Auburn, GA 30011
Estimated Value: $375,000 - $490,000
4
Beds
3
Baths
2,690
Sq Ft
$154/Sq Ft
Est. Value
About This Home
This home is located at 4869 Lily Stem Dr, Auburn, GA 30011 and is currently estimated at $412,925, approximately $153 per square foot. 4869 Lily Stem Dr is a home located in Gwinnett County with nearby schools including Duncan Creek Elementary School, Frank N. Osborne Middle School, and Mill Creek High School.
Ownership History
Date
Name
Owned For
Owner Type
Purchase Details
Closed on
Dec 30, 2008
Sold by
Bear Stearns Series 2006-He7
Bought by
Sherman Dennis O and Sherman Tyjia L
Current Estimated Value
Home Financials for this Owner
Home Financials are based on the most recent Mortgage that was taken out on this home.
Original Mortgage
$136,202
Outstanding Balance
$89,568
Interest Rate
5.95%
Mortgage Type
FHA
Estimated Equity
$323,357
Purchase Details
Closed on
Nov 4, 2008
Sold by
Mason Rhonda M
Bought by
Bear Stearns Series 2006-He7
Home Financials for this Owner
Home Financials are based on the most recent Mortgage that was taken out on this home.
Original Mortgage
$136,202
Outstanding Balance
$89,568
Interest Rate
5.95%
Mortgage Type
FHA
Estimated Equity
$323,357
Purchase Details
Closed on
Apr 28, 2006
Sold by
Legacy Communities Of Flowery
Bought by
Reese Michael and Mason Rhonda
Home Financials for this Owner
Home Financials are based on the most recent Mortgage that was taken out on this home.
Original Mortgage
$165,446
Interest Rate
7.76%
Mortgage Type
New Conventional
Create a Home Valuation Report for This Property
The Home Valuation Report is an in-depth analysis detailing your home's value as well as a comparison with similar homes in the area
Home Values in the Area
Average Home Value in this Area
Purchase History
| Date | Buyer | Sale Price | Title Company |
|---|---|---|---|
| Sherman Dennis O | $138,000 | -- | |
| Bear Stearns Series 2006-He7 | $106,852 | -- | |
| Reese Michael | $206,900 | -- |
Source: Public Records
Mortgage History
| Date | Status | Borrower | Loan Amount |
|---|---|---|---|
| Open | Sherman Dennis O | $136,202 | |
| Previous Owner | Reese Michael | $165,446 |
Source: Public Records
Tax History Compared to Growth
Tax History
| Year | Tax Paid | Tax Assessment Tax Assessment Total Assessment is a certain percentage of the fair market value that is determined by local assessors to be the total taxable value of land and additions on the property. | Land | Improvement |
|---|---|---|---|---|
| 2024 | $4,265 | $142,520 | $26,800 | $115,720 |
| 2023 | $4,265 | $124,800 | $26,800 | $98,000 |
| 2022 | $3,861 | $124,800 | $26,800 | $98,000 |
| 2021 | $3,453 | $102,680 | $20,000 | $82,680 |
| 2020 | $3,000 | $80,640 | $16,000 | $64,640 |
| 2019 | $2,898 | $80,640 | $16,000 | $64,640 |
| 2018 | $2,898 | $80,640 | $16,000 | $64,640 |
| 2016 | $2,199 | $59,800 | $10,800 | $49,000 |
| 2015 | $2,221 | $59,800 | $10,800 | $49,000 |
| 2014 | -- | $48,400 | $10,800 | $37,600 |
Source: Public Records
Map
Nearby Homes
- 4909 Lily Stem Dr
- 4849 Lily Stem Dr
- 4979 Lily Stem Dr
- 6096 Apple Grove Rd
- 6071 Apple Grove Rd
- 5125 Cactus Cove Ln
- 2046 Barberry Dr
- 0 Georgia 124 Unit 10590221
- 2070 Cabela Dr
- 5711 Apple Grove Rd
- 4881 Bill Cheek Rd
- 4657 Water Mill Dr NE
- 5586 Apple Grove Rd
- 2088 Skybrooke Ct
- 4335 Magpie Dr
- 1785 Dartford Way
- 4335 Braselton Hwy Unit tax parcel R3003 327
- 1661 Silver Crest Way
- 4859 Lily Stem Dr
- 4879 Lily Stem Dr
- 4866 Lily Stem Dr
- 4866 Lily Stem Dr
- 4899 Lily Stem Dr
- 4839 Lily Stem Dr
- 4796 Lily Stem Dr
- 4796 Lily Stem Dr
- 4836 Lily Stem Dr
- 4906 Lily Stem Dr
- 4909 Dr
- 4786 Lily Stem Dr
- 4916 Lily Stem Dr
- 4776 Lily Stem Dr
- 4919 Lily Stem Dr
- 4926 Lily Stem Dr
- 4809 Lily Stem Dr
- 4929 Lily Stem Dr
- 4799 Lily Stem Dr
- 4766 Lily Stem Dr