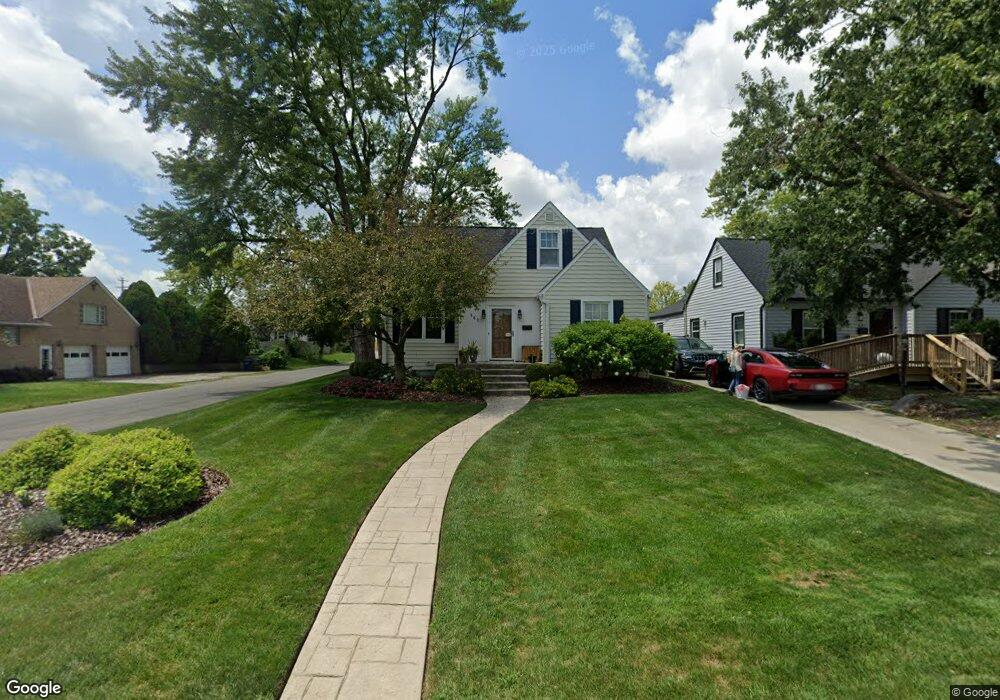
487 Demorest Rd Columbus, OH 43204
Westgate NeighborhoodEstimated Value: $234,000 - $296,000
4
Beds
1
Bath
1,571
Sq Ft
$169/Sq Ft
Est. Value
About This Home
This home is located at 487 Demorest Rd, Columbus, OH 43204 and is currently estimated at $264,820, approximately $168 per square foot. 487 Demorest Rd is a home located in Franklin County with nearby schools including Westgate Alternative Elementary School, Westmoor Middle School, and West High School.
Ownership History
Date
Name
Owned For
Owner Type
Purchase Details
Closed on
Apr 21, 2005
Sold by
Relocation Properties Management Llc
Bought by
Harmon Sean B and Harmon Lisa R
Current Estimated Value
Home Financials for this Owner
Home Financials are based on the most recent Mortgage that was taken out on this home.
Original Mortgage
$112,500
Outstanding Balance
$57,574
Interest Rate
6.06%
Mortgage Type
Purchase Money Mortgage
Estimated Equity
$207,246
Purchase Details
Closed on
Sep 2, 2004
Sold by
Foos Brent R and Foos Jennifer L
Bought by
Relocation Properties Management Llc
Purchase Details
Closed on
Feb 22, 1999
Sold by
Poe Jeffrey A
Bought by
Foos Brent R
Home Financials for this Owner
Home Financials are based on the most recent Mortgage that was taken out on this home.
Original Mortgage
$86,450
Interest Rate
6.62%
Purchase Details
Closed on
Apr 27, 1994
Bought by
Poe Jeffrey A
Purchase Details
Closed on
Apr 27, 1990
Purchase Details
Closed on
Dec 22, 1987
Create a Home Valuation Report for This Property
The Home Valuation Report is an in-depth analysis detailing your home's value as well as a comparison with similar homes in the area
Home Values in the Area
Average Home Value in this Area
Purchase History
| Date | Buyer | Sale Price | Title Company |
|---|---|---|---|
| Harmon Sean B | $125,000 | -- | |
| Relocation Properties Management Llc | $127,000 | -- | |
| Foos Brent R | $91,000 | Chicago Title | |
| Poe Jeffrey A | $79,900 | -- | |
| -- | $69,000 | -- | |
| -- | $62,500 | -- |
Source: Public Records
Mortgage History
| Date | Status | Borrower | Loan Amount |
|---|---|---|---|
| Open | Harmon Sean B | $112,500 | |
| Previous Owner | Foos Brent R | $86,450 |
Source: Public Records
Tax History
| Year | Tax Paid | Tax Assessment Tax Assessment Total Assessment is a certain percentage of the fair market value that is determined by local assessors to be the total taxable value of land and additions on the property. | Land | Improvement |
|---|---|---|---|---|
| 2025 | $3,315 | $73,860 | $21,670 | $52,190 |
| 2024 | $3,315 | $73,860 | $21,670 | $52,190 |
| 2023 | $3,272 | $73,850 | $21,665 | $52,185 |
| 2022 | $2,538 | $48,930 | $7,560 | $41,370 |
| 2021 | $2,542 | $48,930 | $7,560 | $41,370 |
| 2020 | $2,546 | $48,930 | $7,560 | $41,370 |
| 2019 | $2,397 | $39,520 | $6,300 | $33,220 |
| 2018 | $2,234 | $39,520 | $6,300 | $33,220 |
| 2017 | $2,341 | $39,520 | $6,300 | $33,220 |
| 2016 | $2,287 | $34,520 | $4,940 | $29,580 |
| 2015 | $2,076 | $34,520 | $4,940 | $29,580 |
| 2014 | $2,081 | $34,520 | $4,940 | $29,580 |
| 2013 | $1,141 | $38,360 | $5,495 | $32,865 |
Source: Public Records
Map
Nearby Homes
- 408 Derrer Rd
- 328 S Sylvan Ave
- 695 Demorest Rd
- 277 Josephine Ave
- 227 S Sylvan Ave
- 6280 Renner Park Dr
- 162 S Southampton Ave
- 570 S Westgate Ave
- 139 Demorest Ave
- 814 Miriam Dr W
- 840 Mark Place
- 181 S Westgate Ave
- 3001 Wicklow Rd
- 144 S Brinker Ave
- 457 Guernsey Ave
- 77 S Brinker Ave
- 185 S Huron Ave
- 3551 Glorious Rd
- 3340 Miriam Dr S
- 3866 Eakin Rd
- 481 Demorest Rd
- 501 Demorest Rd
- 475 Demorest Rd
- 3442 Parkside Rd
- 467 Demorest Rd
- 507 Demorest Rd
- 484 Derrer Rd
- 502 Derrer Rd
- 476 Derrer Rd
- 513 Demorest Rd
- 461 Demorest Rd
- 508 Derrer Rd
- 468 Derrer Rd
- 3393 Parkside Rd
- 108 Derrer Rd
- 102 Derrer Rd
- 96 Derrer Rd
- 0 Derrer Rd Unit 225007825
- 0 Derrer Rd Unit L210 2023696
- 0 Derrer Rd Unit L211 2023698
Your Personal Tour Guide
Ask me questions while you tour the home.