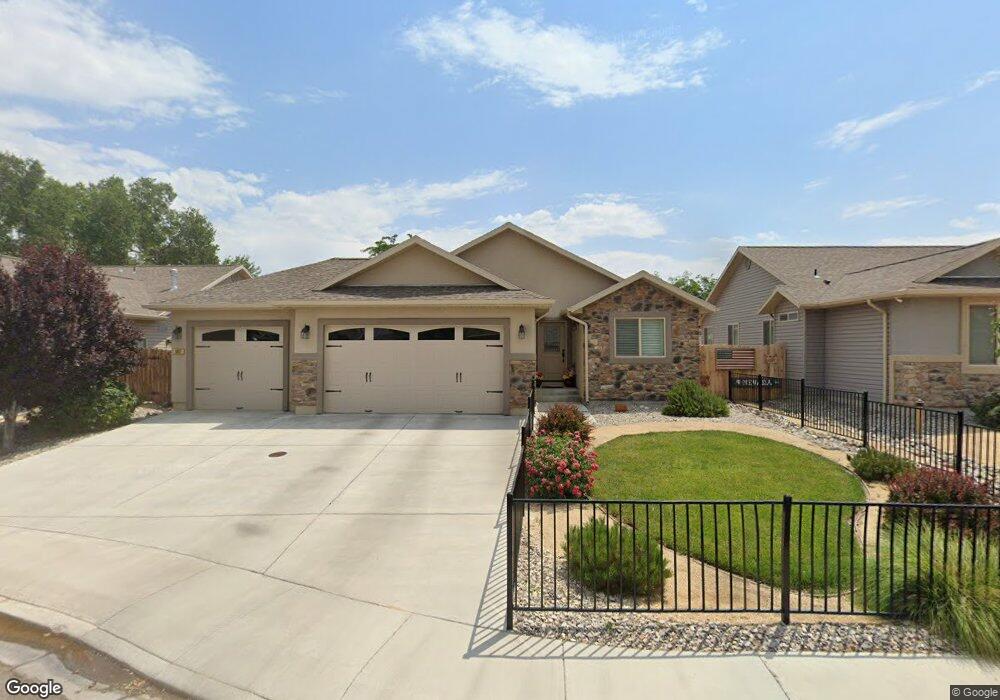
487 Lilac Ln Fernley, NV 89408
Estimated Value: $391,000 - $418,000
3
Beds
2
Baths
1,490
Sq Ft
$269/Sq Ft
Est. Value
About This Home
This home is located at 487 Lilac Ln, Fernley, NV 89408 and is currently estimated at $401,119, approximately $269 per square foot. 487 Lilac Ln is a home with nearby schools including Fernley Elementary School, Fernley Intermediate School, and Fernley High School.
Ownership History
Date
Name
Owned For
Owner Type
Purchase Details
Closed on
Sep 13, 2024
Sold by
Silva Daniel J and Silva Leslie K
Bought by
Silva Family Trust and Silva
Current Estimated Value
Purchase Details
Closed on
Apr 18, 2017
Sold by
Bailey And Associates Llc
Bought by
Silva Daniel J and Silva Leslie K
Home Financials for this Owner
Home Financials are based on the most recent Mortgage that was taken out on this home.
Original Mortgage
$189,044
Interest Rate
4.21%
Mortgage Type
New Conventional
Purchase Details
Closed on
Sep 14, 2015
Sold by
Casey Michael A and Casey Claudia
Bought by
Bailey And Associates Llc
Purchase Details
Closed on
Dec 16, 2014
Sold by
Milsner R L
Bought by
Casey Michael A and Casey Claudia
Purchase Details
Closed on
Nov 18, 2013
Sold by
Mgp Development Llc
Bought by
Milsner R L
Create a Home Valuation Report for This Property
The Home Valuation Report is an in-depth analysis detailing your home's value as well as a comparison with similar homes in the area
Home Values in the Area
Average Home Value in this Area
Purchase History
| Date | Buyer | Sale Price | Title Company |
|---|---|---|---|
| Silva Family Trust | -- | None Listed On Document | |
| Silva Daniel J | $239,780 | Stewart Title Elko | |
| Bailey And Associates Llc | $900,000 | Title Svc & Escrow Fernle | |
| Casey Michael A | $682,500 | Title Service And Escrow | |
| Milsner R L | $2,800,000 | First American Title Paseo V |
Source: Public Records
Mortgage History
| Date | Status | Borrower | Loan Amount |
|---|---|---|---|
| Previous Owner | Silva Daniel J | $189,044 |
Source: Public Records
Tax History Compared to Growth
Tax History
| Year | Tax Paid | Tax Assessment Tax Assessment Total Assessment is a certain percentage of the fair market value that is determined by local assessors to be the total taxable value of land and additions on the property. | Land | Improvement |
|---|---|---|---|---|
| 2025 | $3,294 | $119,379 | $35,000 | $84,379 |
| 2024 | $3,608 | $119,400 | $35,000 | $84,399 |
| 2023 | $3,608 | $113,738 | $35,000 | $78,738 |
| 2022 | $3,396 | $107,144 | $35,000 | $72,144 |
| 2021 | $3,333 | $103,328 | $33,250 | $70,078 |
| 2020 | $3,243 | $88,100 | $21,000 | $67,100 |
| 2019 | $3,230 | $85,400 | $21,000 | $64,400 |
| 2018 | $3,100 | $80,097 | $17,500 | $62,597 |
| 2017 | $3,025 | $75,493 | $13,130 | $62,363 |
| 2016 | $332 | $3,470 | $3,470 | $0 |
| 2015 | $354 | $3,470 | $3,470 | $0 |
| 2014 | $352 | $3,470 | $3,470 | $0 |
Source: Public Records
Map
Nearby Homes