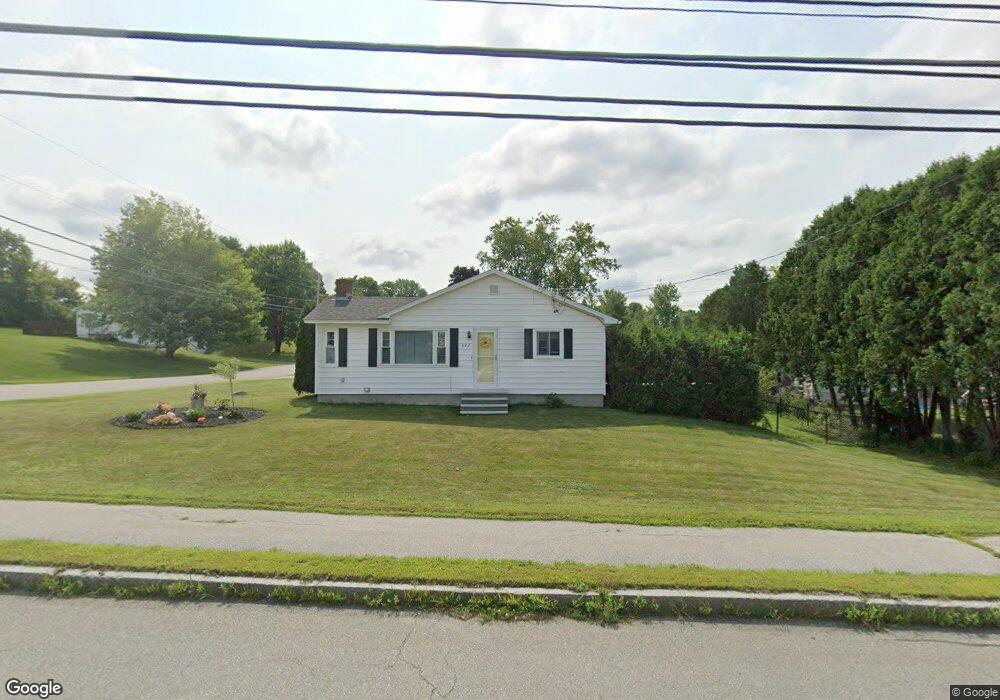
487 N Main St Brewer, ME 04412
Estimated Value: $252,033 - $306,000
3
Beds
1
Bath
1,008
Sq Ft
$278/Sq Ft
Est. Value
About This Home
This home is located at 487 N Main St, Brewer, ME 04412 and is currently estimated at $279,758, approximately $277 per square foot. 487 N Main St is a home located in Penobscot County with nearby schools including Brewer Community School, Brewer High School, and All Saints Catholic School St. Mary's campus PreK-3.
Ownership History
Date
Name
Owned For
Owner Type
Purchase Details
Closed on
Nov 26, 2013
Sold by
Baker Randy S
Bought by
Baker Michele L
Current Estimated Value
Home Financials for this Owner
Home Financials are based on the most recent Mortgage that was taken out on this home.
Original Mortgage
$106,400
Outstanding Balance
$78,437
Interest Rate
4.25%
Mortgage Type
New Conventional
Estimated Equity
$201,321
Purchase Details
Closed on
May 2, 2011
Sold by
French-Downing Gloria J
Bought by
Baker Randy S and Baker Michele L
Home Financials for this Owner
Home Financials are based on the most recent Mortgage that was taken out on this home.
Original Mortgage
$102,400
Interest Rate
4.76%
Mortgage Type
Purchase Money Mortgage
Create a Home Valuation Report for This Property
The Home Valuation Report is an in-depth analysis detailing your home's value as well as a comparison with similar homes in the area
Home Values in the Area
Average Home Value in this Area
Purchase History
| Date | Buyer | Sale Price | Title Company |
|---|---|---|---|
| Baker Michele L | -- | -- | |
| Baker Michele L | -- | -- | |
| Baker Randy S | -- | -- | |
| Baker Randy S | -- | -- |
Source: Public Records
Mortgage History
| Date | Status | Borrower | Loan Amount |
|---|---|---|---|
| Open | Baker Michele L | $106,400 | |
| Closed | Baker Randy S | $106,400 | |
| Closed | Baker Randy S | $102,400 | |
| Previous Owner | Baker Randy S | $9,000 |
Source: Public Records
Tax History
| Year | Tax Paid | Tax Assessment Tax Assessment Total Assessment is a certain percentage of the fair market value that is determined by local assessors to be the total taxable value of land and additions on the property. | Land | Improvement |
|---|---|---|---|---|
| 2025 | $3,385 | $219,800 | $25,400 | $194,400 |
| 2024 | $3,365 | $179,000 | $25,400 | $153,600 |
| 2023 | $3,270 | $162,700 | $23,600 | $139,100 |
| 2021 | $3,171 | $142,200 | $23,300 | $118,900 |
| 2020 | $1,970 | $140,300 | $23,300 | $117,000 |
| 2019 | $1,893 | $140,300 | $23,300 | $117,000 |
| 2018 | $2,774 | $123,300 | $23,300 | $100,000 |
| 2017 | $1,820 | $123,300 | $23,300 | $100,000 |
| 2016 | $2,653 | $123,300 | $23,300 | $100,000 |
| 2015 | $2,438 | $123,300 | $23,300 | $100,000 |
| 2014 | $2,579 | $123,300 | $23,300 | $100,000 |
| 2013 | $2,741 | $131,000 | $22,200 | $108,800 |
Source: Public Records
Map
Nearby Homes
Your Personal Tour Guide
Ask me questions while you tour the home.