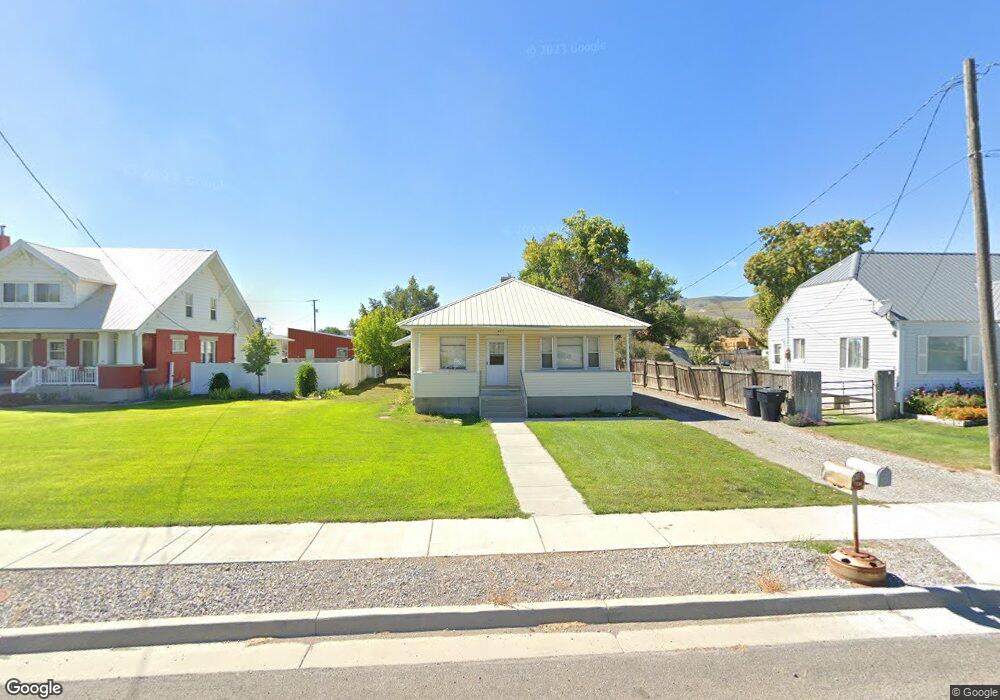
487 N Main St Garland, UT 84312
Estimated Value: $289,000 - $369,000
2
Beds
1
Bath
1,220
Sq Ft
$260/Sq Ft
Est. Value
About This Home
This home is located at 487 N Main St, Garland, UT 84312 and is currently estimated at $317,482, approximately $260 per square foot. 487 N Main St is a home located in Box Elder County with nearby schools including Fielding School, Bear River Middle School, and Alice C. Harris Intermediate School.
Ownership History
Date
Name
Owned For
Owner Type
Purchase Details
Closed on
Nov 10, 2019
Sold by
Munns Thomas F and Munns Sinthia W
Bought by
Tsam Holdings Llc
Current Estimated Value
Purchase Details
Closed on
Dec 11, 2013
Sold by
Nye Jean G
Bought by
Munns Thomas F and Munns Sinthia W
Purchase Details
Closed on
Oct 7, 2010
Sold by
Nye Jean G
Bought by
Nye Jean G
Create a Home Valuation Report for This Property
The Home Valuation Report is an in-depth analysis detailing your home's value as well as a comparison with similar homes in the area
Home Values in the Area
Average Home Value in this Area
Purchase History
| Date | Buyer | Sale Price | Title Company |
|---|---|---|---|
| Tsam Holdings Llc | -- | None Available | |
| Munns Thomas F | -- | Box Elder Land Title Compan | |
| Nye Jean G | -- | None Available |
Source: Public Records
Tax History Compared to Growth
Tax History
| Year | Tax Paid | Tax Assessment Tax Assessment Total Assessment is a certain percentage of the fair market value that is determined by local assessors to be the total taxable value of land and additions on the property. | Land | Improvement |
|---|---|---|---|---|
| 2025 | $1,480 | $261,479 | $105,000 | $156,479 |
| 2024 | $1,480 | $254,101 | $100,000 | $154,101 |
| 2023 | $1,490 | $252,401 | $90,000 | $162,401 |
| 2022 | $1,375 | $218,357 | $30,000 | $188,357 |
| 2021 | $1,148 | $138,085 | $30,000 | $108,085 |
| 2020 | $993 | $138,085 | $30,000 | $108,085 |
| 2019 | $938 | $69,108 | $16,500 | $52,608 |
| 2018 | $658 | $45,297 | $16,500 | $28,797 |
| 2017 | $683 | $82,359 | $16,500 | $52,359 |
| 2016 | $651 | $43,926 | $16,500 | $27,426 |
| 2015 | $624 | $41,433 | $16,500 | $24,933 |
| 2014 | $624 | $40,246 | $16,500 | $23,746 |
| 2013 | -- | $40,246 | $13,338 | $26,908 |
Source: Public Records
Map
Nearby Homes