487 N Main St Santaquin, UT 84655
Estimated Value: $960,000 - $1,200,000
3
Beds
5
Baths
1,873
Sq Ft
$575/Sq Ft
Est. Value
About This Home
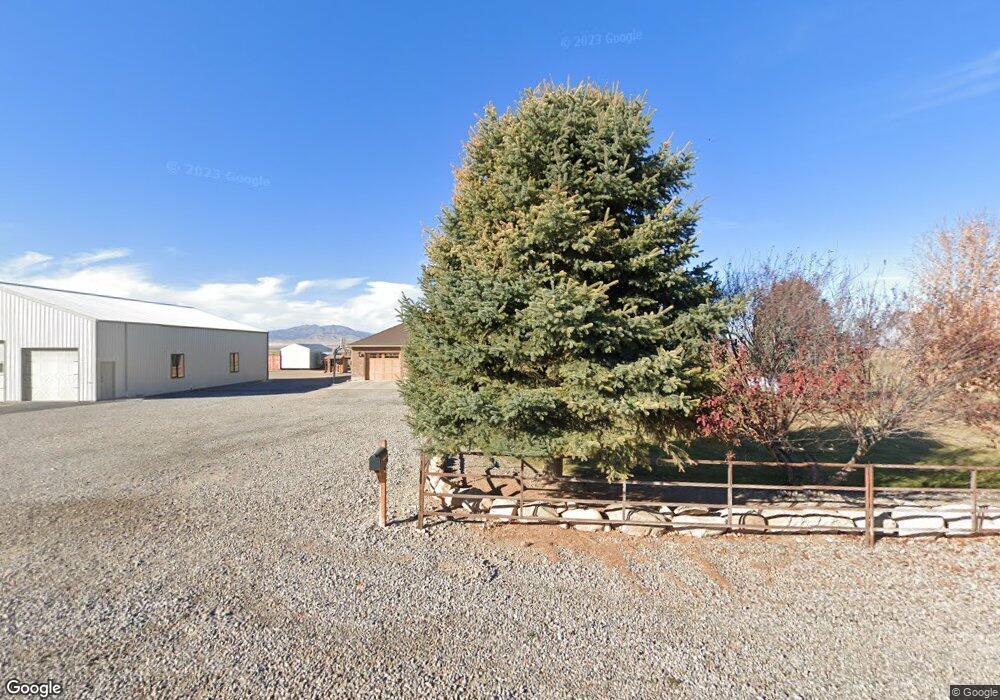
This home is located at 487 N Main St, Santaquin, UT 84655 and is currently estimated at $1,077,052, approximately $575 per square foot. 487 N Main St is a home with nearby schools including Goshen Elementary school, Payson Junior High School, and Payson High School.
Ownership History
Date
Name
Owned For
Owner Type
Purchase Details
Closed on
Jan 14, 2022
Sold by
Wayne Pincock Larry
Bought by
Healey Michael E
Current Estimated Value
Home Financials for this Owner
Home Financials are based on the most recent Mortgage that was taken out on this home.
Original Mortgage
$815,000
Outstanding Balance
$750,532
Interest Rate
3.05%
Mortgage Type
New Conventional
Estimated Equity
$326,520
Purchase Details
Closed on
Apr 20, 2020
Sold by
Pincock Larry and Pincock Vickie
Bought by
Pincock Larry Wayne and Pincock Vickie Lynn
Home Financials for this Owner
Home Financials are based on the most recent Mortgage that was taken out on this home.
Original Mortgage
$480,000
Interest Rate
3.3%
Mortgage Type
New Conventional
Purchase Details
Closed on
Apr 15, 2016
Sold by
Burningham David B and Burningham Jana L
Bought by
Pincock Larry and Pincock Vickie
Home Financials for this Owner
Home Financials are based on the most recent Mortgage that was taken out on this home.
Original Mortgage
$332,000
Interest Rate
3.73%
Mortgage Type
New Conventional
Purchase Details
Closed on
Feb 28, 2013
Sold by
Burningham E Scott and Burningham Joanie M
Bought by
Burningham David B and Burningham Jana L
Home Financials for this Owner
Home Financials are based on the most recent Mortgage that was taken out on this home.
Original Mortgage
$249,898
Interest Rate
3.5%
Mortgage Type
FHA
Purchase Details
Closed on
Sep 13, 2011
Sold by
Bertschi James and Bertschi Anne
Bought by
Burningham E Scott and Burningham Joanie M
Home Financials for this Owner
Home Financials are based on the most recent Mortgage that was taken out on this home.
Original Mortgage
$230,250
Interest Rate
4.09%
Mortgage Type
New Conventional
Purchase Details
Closed on
Dec 29, 2006
Sold by
Francom Quentin L and Francom Kristine T
Bought by
Bertschi James and Bertschi Anne
Home Financials for this Owner
Home Financials are based on the most recent Mortgage that was taken out on this home.
Original Mortgage
$320,000
Interest Rate
6.1%
Mortgage Type
Purchase Money Mortgage
Purchase Details
Closed on
Apr 7, 2006
Sold by
Thomas Bonnie Jean Larson and Johnson Marjorie Ellen Larson
Bought by
Francom Quentin L and Francom Kristine T
Home Financials for this Owner
Home Financials are based on the most recent Mortgage that was taken out on this home.
Original Mortgage
$85,000
Interest Rate
6.35%
Mortgage Type
Seller Take Back
Create a Home Valuation Report for This Property
The Home Valuation Report is an in-depth analysis detailing your home's value as well as a comparison with similar homes in the area
Home Values in the Area
Average Home Value in this Area
Purchase History
| Date | Buyer | Sale Price | Title Company |
|---|---|---|---|
| Healey Michael E | -- | Metro National Title | |
| Pincock Larry Wayne | -- | Metro National Title | |
| Pincock Larry | -- | Select Title Insurance Agenc | |
| Burningham David B | -- | Select Title Ins Agency Inc | |
| Burningham E Scott | -- | Gt Title Services Spanish F | |
| Bertschi James | -- | None Available | |
| Francom Quentin L | -- | None Available |
Source: Public Records
Mortgage History
| Date | Status | Borrower | Loan Amount |
|---|---|---|---|
| Open | Healey Michael E | $815,000 | |
| Previous Owner | Pincock Larry Wayne | $480,000 | |
| Previous Owner | Pincock Larry | $332,000 | |
| Previous Owner | Burningham David B | $249,898 | |
| Previous Owner | Burningham E Scott | $230,250 | |
| Previous Owner | Bertschi James | $320,000 | |
| Previous Owner | Francom Quentin L | $85,000 |
Source: Public Records
Tax History Compared to Growth
Tax History
| Year | Tax Paid | Tax Assessment Tax Assessment Total Assessment is a certain percentage of the fair market value that is determined by local assessors to be the total taxable value of land and additions on the property. | Land | Improvement |
|---|---|---|---|---|
| 2025 | $4,435 | $514,085 | $302,400 | $563,900 |
| 2024 | $4,435 | $458,770 | $0 | $0 |
| 2023 | $4,366 | $452,360 | $0 | $0 |
| 2022 | $4,058 | $701,700 | $307,100 | $394,600 |
| 2021 | $3,548 | $536,700 | $212,000 | $324,700 |
| 2020 | $3,294 | $482,600 | $166,700 | $315,900 |
| 2019 | $3,019 | $453,100 | $158,800 | $294,300 |
| 2018 | $2,885 | $413,600 | $138,800 | $274,800 |
| 2017 | $2,832 | $241,835 | $0 | $0 |
| 2016 | $2,860 | $245,535 | $0 | $0 |
| 2015 | $2,892 | $245,535 | $0 | $0 |
| 2014 | $2,880 | $245,635 | $0 | $0 |
Source: Public Records
Map
Nearby Homes
- 956 N Main St
- 1220 N Hillside Dr
- 1010 S Anna Ekins Memorial Ln
- 975 E 715 S
- 692 Frost St Unit 84
- 688 Frost St Unit 85
- 686 W Frost St Unit 86
- 346 Red Rock Dr
- 402 Topaz Dr
- 358 W 910 N
- 11508 S 5825 W
- 251 N Polly Ln
- 251 N Polly Ln Unit 4
- 245 N Polly Ln Unit 2
- 245 N Polly Ln
- 241 N Polly Ln Unit 1
- 689 Empress St Unit 78
- 685 Empress St Unit 79
- 931 N 215 W
- 369 N 500 W Unit 3