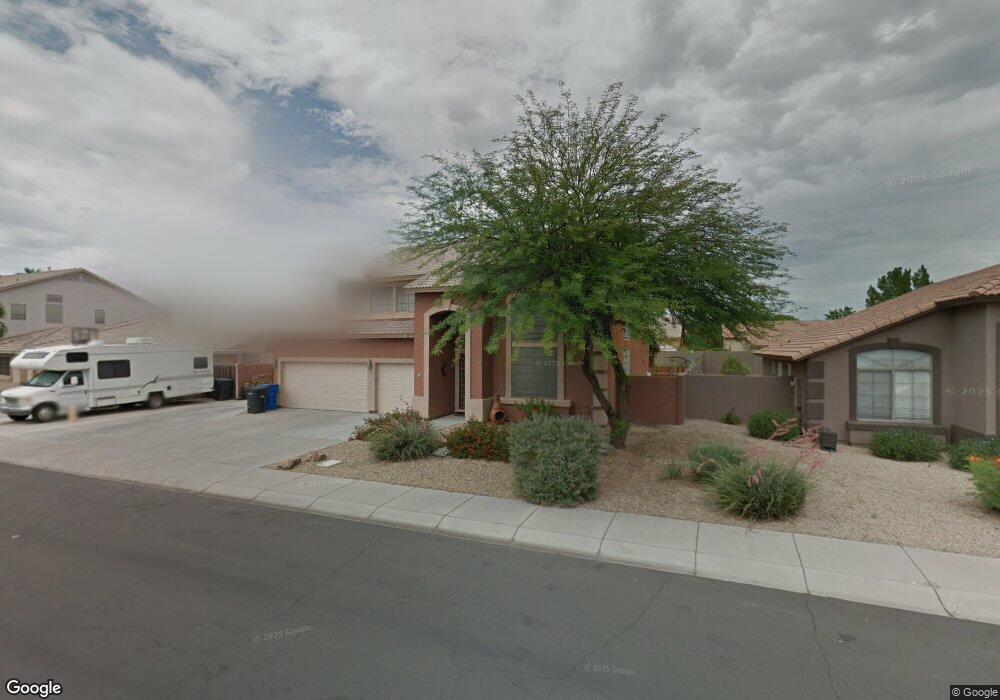
487 N Newport St Chandler, AZ 85225
East Chandler NeighborhoodEstimated Value: $662,549 - $764,000
--
Bed
5
Baths
3,142
Sq Ft
$227/Sq Ft
Est. Value
About This Home
This home is located at 487 N Newport St, Chandler, AZ 85225 and is currently estimated at $713,137, approximately $226 per square foot. 487 N Newport St is a home located in Maricopa County with nearby schools including Sanborn Elementary School, Willis Junior High School, and Chandler High School.
Ownership History
Date
Name
Owned For
Owner Type
Purchase Details
Closed on
Oct 11, 2020
Sold by
Gross Erik and Gross Shannon
Bought by
Gross Erik and Gross Shannon
Current Estimated Value
Home Financials for this Owner
Home Financials are based on the most recent Mortgage that was taken out on this home.
Original Mortgage
$146,500
Outstanding Balance
$117,929
Interest Rate
2.9%
Mortgage Type
New Conventional
Estimated Equity
$595,208
Purchase Details
Closed on
Mar 19, 2015
Sold by
Gross Erik and Gross Shannon
Bought by
The Gross Family Trust and Gross Shannon
Purchase Details
Closed on
Jan 22, 1998
Sold by
Greystone Homes Inc
Bought by
Gross Erik A and Gross Shannon Lp
Home Financials for this Owner
Home Financials are based on the most recent Mortgage that was taken out on this home.
Original Mortgage
$140,600
Interest Rate
6.97%
Mortgage Type
New Conventional
Create a Home Valuation Report for This Property
The Home Valuation Report is an in-depth analysis detailing your home's value as well as a comparison with similar homes in the area
Home Values in the Area
Average Home Value in this Area
Purchase History
| Date | Buyer | Sale Price | Title Company |
|---|---|---|---|
| Gross Erik | -- | Accommodation | |
| Gross Erik | -- | Security Title Agency Inc | |
| The Gross Family Trust | -- | None Available | |
| Gross Erik A | $176,544 | First American Title |
Source: Public Records
Mortgage History
| Date | Status | Borrower | Loan Amount |
|---|---|---|---|
| Open | Gross Erik | $146,500 | |
| Previous Owner | Gross Erik A | $140,600 |
Source: Public Records
Tax History Compared to Growth
Tax History
| Year | Tax Paid | Tax Assessment Tax Assessment Total Assessment is a certain percentage of the fair market value that is determined by local assessors to be the total taxable value of land and additions on the property. | Land | Improvement |
|---|---|---|---|---|
| 2025 | $2,716 | $34,862 | -- | -- |
| 2024 | $2,623 | $33,202 | -- | -- |
| 2023 | $2,623 | $52,420 | $10,480 | $41,940 |
| 2022 | $2,531 | $39,130 | $7,820 | $31,310 |
| 2021 | $2,653 | $37,400 | $7,480 | $29,920 |
| 2020 | $2,641 | $35,750 | $7,150 | $28,600 |
| 2019 | $2,540 | $34,230 | $6,840 | $27,390 |
| 2018 | $2,459 | $32,830 | $6,560 | $26,270 |
| 2017 | $2,292 | $31,070 | $6,210 | $24,860 |
| 2016 | $2,208 | $30,320 | $6,060 | $24,260 |
| 2015 | $2,140 | $30,750 | $6,150 | $24,600 |
Source: Public Records
Map
Nearby Homes
- 420 N Leoma Ln
- 110 N Velero St
- 1605 E Chandler Blvd Unit 26
- 642 N Danyell Ct
- 245 N Bedford St
- 1590 E Robinson Way
- 1075 E Chandler Blvd Unit 119
- 155 N Lakeview Blvd Unit 208
- 155 N Lakeview Blvd Unit 108
- 155 N Lakeview Blvd Unit 204
- 791 N Velero St
- 1664 E Buffalo Cir
- 403 N Monte Vista St
- 1853 E Shannon St
- 240 N Monte Vista St
- 874 E Tyson St
- 741 N Soho Place
- 941 N Adams Ct
- 1467 E Boston St
- 83 N Amber Ct
- 497 N Newport St
- 477 N Newport St
- 508 N Leoma Ln
- 516 N Leoma Ln
- 500 N Leoma Ln
- 1485 E Oakland St
- 507 N Newport St
- 467 N Newport St
- 492 N Leoma Ln
- 1484 E Carla Vista Dr Unit 3
- 532 N Leoma Ln
- 1471 E Oakland St
- 506 N Newport St
- 517 N Newport St
- 457 N Newport St
- 484 N Leoma Ln
- 1470 E Carla Vista Dr
- 1523 E Oakland St
- 540 N Leoma Ln
- 516 N Newport St