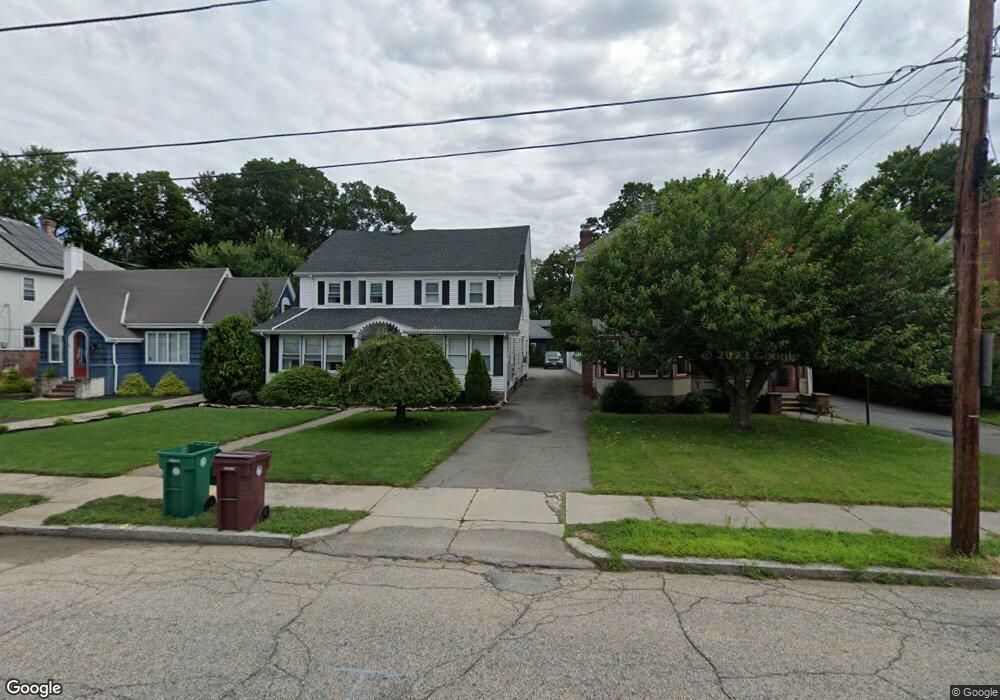
487 Prospect St Woonsocket, RI 02895
North End NeighborhoodEstimated Value: $564,117 - $682,000
6
Beds
4
Baths
3,485
Sq Ft
$181/Sq Ft
Est. Value
About This Home
This home is located at 487 Prospect St, Woonsocket, RI 02895 and is currently estimated at $631,279, approximately $181 per square foot. 487 Prospect St is a home located in Providence County with nearby schools including Woonsocket High School, Rise Prep Mayoral Academy Middle School, and Rise Prep Mayoral Academy.
Ownership History
Date
Name
Owned For
Owner Type
Purchase Details
Closed on
Nov 20, 2012
Sold by
Lefort Robert L and Lefort Nicole I
Bought by
Groleau Peter and Grileau Kerrie M
Current Estimated Value
Home Financials for this Owner
Home Financials are based on the most recent Mortgage that was taken out on this home.
Original Mortgage
$224,730
Outstanding Balance
$154,736
Interest Rate
3.39%
Mortgage Type
New Conventional
Estimated Equity
$476,543
Purchase Details
Closed on
Nov 26, 1997
Sold by
Franco Gertrude A
Bought by
Lefort Robert L and Lefort Nicole
Create a Home Valuation Report for This Property
The Home Valuation Report is an in-depth analysis detailing your home's value as well as a comparison with similar homes in the area
Home Values in the Area
Average Home Value in this Area
Purchase History
| Date | Buyer | Sale Price | Title Company |
|---|---|---|---|
| Groleau Peter | $220,000 | -- | |
| Groleau Peter | $220,000 | -- | |
| Lefort Robert L | $110,000 | -- | |
| Lefort Robert L | $110,000 | -- |
Source: Public Records
Mortgage History
| Date | Status | Borrower | Loan Amount |
|---|---|---|---|
| Open | Lefort Robert L | $224,730 | |
| Closed | Lefort Robert L | $224,730 | |
| Previous Owner | Lefort Robert L | $132,000 | |
| Previous Owner | Lefort Robert L | $14,200 |
Source: Public Records
Tax History
| Year | Tax Paid | Tax Assessment Tax Assessment Total Assessment is a certain percentage of the fair market value that is determined by local assessors to be the total taxable value of land and additions on the property. | Land | Improvement |
|---|---|---|---|---|
| 2025 | $6,775 | $603,300 | $106,700 | $496,600 |
| 2024 | $5,913 | $406,700 | $87,100 | $319,600 |
| 2023 | $5,686 | $406,700 | $87,100 | $319,600 |
| 2022 | $5,686 | $406,700 | $87,100 | $319,600 |
| 2021 | $4,950 | $208,400 | $69,300 | $139,100 |
| 2020 | $5,002 | $208,400 | $69,300 | $139,100 |
| 2018 | $5,018 | $208,400 | $69,300 | $139,100 |
| 2017 | $6,252 | $207,700 | $64,600 | $143,100 |
| 2016 | $6,613 | $207,700 | $64,600 | $143,100 |
| 2015 | $7,598 | $207,700 | $64,600 | $143,100 |
| 2014 | $6,858 | $209,700 | $71,100 | $138,600 |
Source: Public Records
Map
Nearby Homes
- 154 156 Winter St
- 550 Winter St
- 60 Fairlawn Ave
- 571 Winter St
- 10 Huntington Ave
- 481 N Main St
- 164 W School St
- 11 Federal St
- 130 E School St
- 187 Boyden St
- 44 Federal St
- 107 Blackstone St
- 0 N Main St Unit 1401765
- 256 Privilege St
- 99 Cato St
- 36 Fairmount St
- 115 Railroad St
- 0 Diamond Hill Rd Unit 1406968
- 76 Main St
- 40 Valley St
- 477 Prospect St
- 519 Prospect St
- 521 Prospect St
- 467 Prospect St
- 525 Prospect St
- 455 Prospect St
- 396 Summer St
- 36 Trent St
- 414 Summer St
- 529 Prospect St
- 482 Prospect St
- 531 Prospect St
- 470 Prospect St
- 506 Prospect St
- 378 Summer St
- 460 Prospect St
- 520 Prospect St
- 404 Summer St
- 433 Prospect St
- 43 Trent St
Your Personal Tour Guide
Ask me questions while you tour the home.