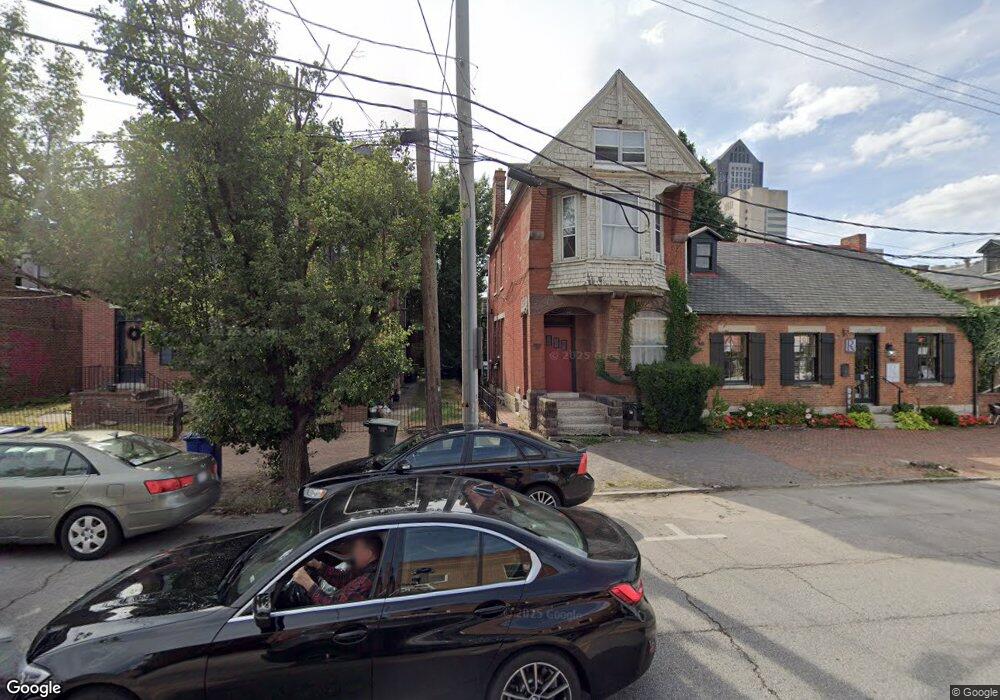
487 S 3rd St Columbus, OH 43215
German Village NeighborhoodEstimated Value: $464,000 - $640,000
4
Beds
2
Baths
2,178
Sq Ft
$253/Sq Ft
Est. Value
About This Home
This home is located at 487 S 3rd St, Columbus, OH 43215 and is currently estimated at $550,626, approximately $252 per square foot. 487 S 3rd St is a home located in Franklin County with nearby schools including Stewart Alternative Elementary School @ Beck Elementary School, South High School, and South Columbus Preparatory Academy.
Ownership History
Date
Name
Owned For
Owner Type
Purchase Details
Closed on
Mar 12, 2004
Sold by
Tobler Ted J and Tobler Janet
Bought by
Cowell Richard
Current Estimated Value
Home Financials for this Owner
Home Financials are based on the most recent Mortgage that was taken out on this home.
Original Mortgage
$152,000
Interest Rate
5.74%
Mortgage Type
Purchase Money Mortgage
Purchase Details
Closed on
Jan 15, 2003
Sold by
Tobler Ted J and Ted J Tobler Living Trust
Bought by
Tobler Ted J and Tobler Janet
Home Financials for this Owner
Home Financials are based on the most recent Mortgage that was taken out on this home.
Original Mortgage
$142,000
Interest Rate
6.13%
Purchase Details
Closed on
Jan 16, 2001
Sold by
Tobler Ted and Tobler Janet
Bought by
Tobler Ted J and Ted J Tobler Living Trust
Purchase Details
Closed on
Aug 28, 1998
Sold by
Henderson Lenora and Johnson Lenora
Bought by
Tobler Ted and Tobler Janet
Purchase Details
Closed on
Jun 1, 1979
Create a Home Valuation Report for This Property
The Home Valuation Report is an in-depth analysis detailing your home's value as well as a comparison with similar homes in the area
Home Values in the Area
Average Home Value in this Area
Purchase History
| Date | Buyer | Sale Price | Title Company |
|---|---|---|---|
| Cowell Richard | $190,000 | -- | |
| Tobler Ted J | -- | -- | |
| Tobler Ted J | -- | -- | |
| Tobler Ted | $126,500 | Amerititle Agency Inc | |
| -- | $30,000 | -- |
Source: Public Records
Mortgage History
| Date | Status | Borrower | Loan Amount |
|---|---|---|---|
| Previous Owner | Cowell Richard | $152,000 | |
| Previous Owner | Tobler Ted J | $142,000 |
Source: Public Records
Tax History
| Year | Tax Paid | Tax Assessment Tax Assessment Total Assessment is a certain percentage of the fair market value that is determined by local assessors to be the total taxable value of land and additions on the property. | Land | Improvement |
|---|---|---|---|---|
| 2025 | $6,173 | $134,690 | $61,290 | $73,400 |
| 2024 | $6,173 | $134,690 | $61,290 | $73,400 |
| 2023 | $6,096 | $134,690 | $61,290 | $73,400 |
| 2022 | $5,255 | $98,880 | $24,150 | $74,730 |
| 2021 | $5,264 | $98,880 | $24,150 | $74,730 |
| 2020 | $5,272 | $98,880 | $24,150 | $74,730 |
| 2019 | $5,450 | $87,640 | $21,000 | $66,640 |
| 2018 | $4,904 | $87,640 | $21,000 | $66,640 |
| 2017 | $5,130 | $87,640 | $21,000 | $66,640 |
| 2016 | $4,879 | $72,730 | $18,550 | $54,180 |
| 2015 | $4,436 | $72,730 | $18,550 | $54,180 |
| 2014 | $4,447 | $72,730 | $18,550 | $54,180 |
| 2013 | $2,088 | $69,230 | $17,640 | $51,590 |
Source: Public Records
Map
Nearby Homes
- 496 S 3rd St
- 582 S Pearl St Unit 582
- 169 E Livingston Ave
- 570 S Front St Unit 312
- 570 S Front St Unit 104
- 112 E Mound St Unit 1
- 115 E Noble St Unit 3
- 186 E Sycamore St
- 309 S 4th St
- 717 S 3rd St
- 46 E Frankfort St
- 242 E Sycamore St
- 279-281 E Beck St
- 150 E Main St Unit 605
- 150 E Main St Unit 409
- 150 E Main St Unit 301
- 308 Jackson St
- 722 Mohawk St Unit 722
- 33 E Frankfort St
- 718 Macon Aly
- 481 S 3rd St
- Short N. Confidential & Deli
- 495 S 3rd St
- 486 City Park Ave
- 503 S 3rd St
- 490 City Park Ave Unit b6
- 78 E Blenkner St
- 74 E Blenkner St
- 476 City Park Ave Unit C
- 476 City Park Ave Unit D
- 476 City Park Ave Unit B
- 476 City Park Ave Unit A
- 476 City Park Ave
- 0 S 3rd St
- 65 E Livingston Ave
- 63 E Livingston Ave
- 502 S 3rd St
- 55 E Livingston Ave Unit 302
- 515 S 3rd St
- 492 S 3rd St Unit 1
Your Personal Tour Guide
Ask me questions while you tour the home.