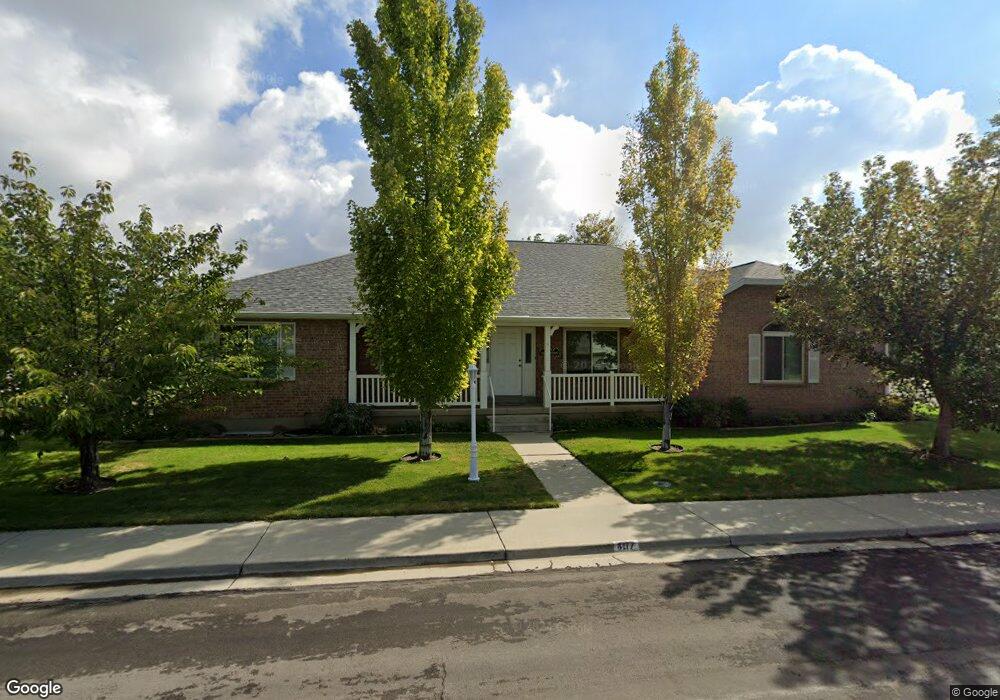
487 S 490 W Orem, UT 84058
Sunset Heights NeighborhoodEstimated Value: $685,376 - $739,000
4
Beds
3
Baths
2,810
Sq Ft
$255/Sq Ft
Est. Value
About This Home
This home is located at 487 S 490 W, Orem, UT 84058 and is currently estimated at $716,125, approximately $254 per square foot. 487 S 490 W is a home with nearby schools including Orem Elementary School, Lakeridge Jr High School, and Mountain View High School.
Ownership History
Date
Name
Owned For
Owner Type
Purchase Details
Closed on
Mar 31, 1998
Sold by
Sant Carol and Sant Janet
Bought by
Sant Carol and Sant Janet
Current Estimated Value
Home Financials for this Owner
Home Financials are based on the most recent Mortgage that was taken out on this home.
Original Mortgage
$67,500
Interest Rate
7%
Purchase Details
Closed on
Mar 19, 1998
Sold by
Sant Delmar W and Sant Leah I
Bought by
Sant Carol and Sant Janet
Home Financials for this Owner
Home Financials are based on the most recent Mortgage that was taken out on this home.
Original Mortgage
$67,500
Interest Rate
7%
Create a Home Valuation Report for This Property
The Home Valuation Report is an in-depth analysis detailing your home's value as well as a comparison with similar homes in the area
Home Values in the Area
Average Home Value in this Area
Purchase History
| Date | Buyer | Sale Price | Title Company |
|---|---|---|---|
| Sant Carol | -- | -- | |
| Sant Carol | -- | Empire Land Title Inc |
Source: Public Records
Mortgage History
| Date | Status | Borrower | Loan Amount |
|---|---|---|---|
| Closed | Sant Carol | $67,500 |
Source: Public Records
Tax History
| Year | Tax Paid | Tax Assessment Tax Assessment Total Assessment is a certain percentage of the fair market value that is determined by local assessors to be the total taxable value of land and additions on the property. | Land | Improvement |
|---|---|---|---|---|
| 2025 | $3,163 | $397,155 | -- | -- |
| 2024 | $3,163 | $386,760 | $0 | $0 |
| 2023 | $2,985 | $392,315 | $0 | $0 |
| 2022 | $3,105 | $395,340 | $0 | $0 |
| 2021 | $2,989 | $576,400 | $194,500 | $381,900 |
| 2020 | $2,811 | $532,800 | $169,100 | $363,700 |
| 2019 | $2,463 | $485,400 | $169,100 | $316,300 |
| 2018 | $2,167 | $408,100 | $133,100 | $275,000 |
| 2017 | $2,127 | $214,555 | $0 | $0 |
| 2016 | $2,264 | $210,595 | $0 | $0 |
| 2015 | $2,394 | $210,595 | $0 | $0 |
| 2014 | $2,111 | $184,910 | $0 | $0 |
Source: Public Records
Map
Nearby Homes
- 216 S 400 W
- 308 W 730 S
- 193 W 530 S
- 520 S 800 W Unit 14
- 506 S 800 West St Unit 13
- 570 S 800 West St Unit 15
- 881 S 635 W
- 302 W 100 S
- 64 S 320 W
- 935 W 360 S
- 207 W 800 S
- 510 S 20 E
- 565 W 40 N
- 508 W 40 N
- 237 S Ridgeview Dr
- 217 W 900 S
- 62 N 380 W
- 62 N Garden Park Dr Unit 8
- 87 E 600 S Unit D
- 55 Hanover Dr
Your Personal Tour Guide
Ask me questions while you tour the home.