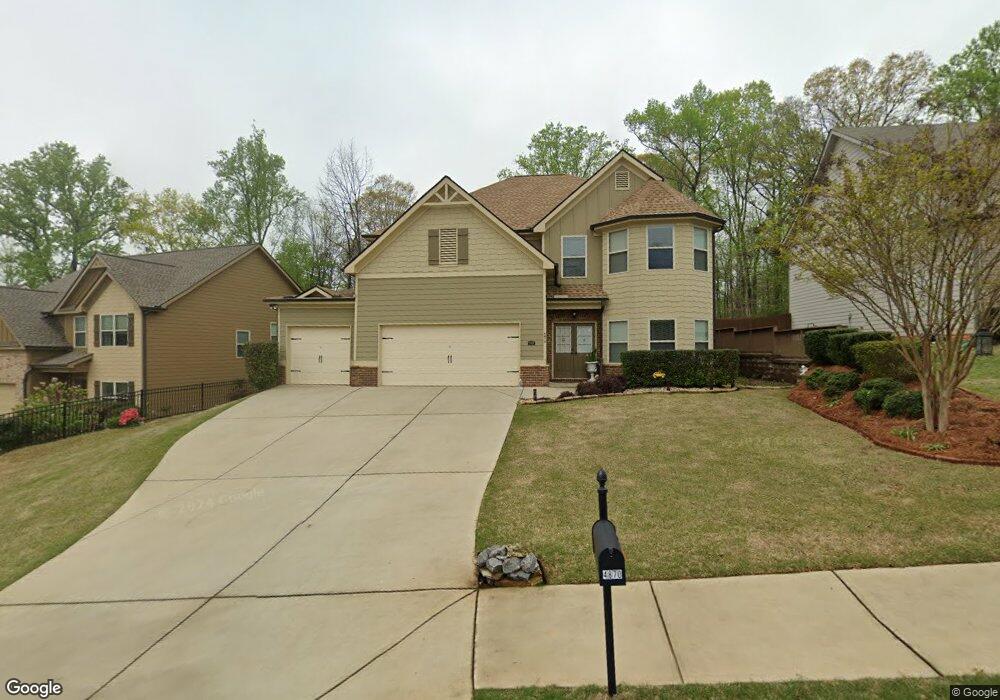
4870 Belcrest Way Unit 35 Cumming, GA 30040
Estimated Value: $537,992 - $605,000
4
Beds
3
Baths
2,989
Sq Ft
$188/Sq Ft
Est. Value
About This Home
This home is located at 4870 Belcrest Way Unit 35, Cumming, GA 30040 and is currently estimated at $562,248, approximately $188 per square foot. 4870 Belcrest Way Unit 35 is a home located in Forsyth County with nearby schools including Coal Mountain Elementary School, North Forsyth Middle School, and North Forsyth High School.
Ownership History
Date
Name
Owned For
Owner Type
Purchase Details
Closed on
Mar 11, 2019
Sold by
Wilkie Robert D
Bought by
Kats Semen and Kats Tatyana
Current Estimated Value
Purchase Details
Closed on
Jan 19, 2017
Bought by
Wilkie Robert D and Wilkie Rhonda
Home Financials for this Owner
Home Financials are based on the most recent Mortgage that was taken out on this home.
Original Mortgage
$298,954
Interest Rate
4.3%
Mortgage Type
New Conventional
Purchase Details
Closed on
Dec 2, 2015
Sold by
Reo Funding Solutions Iii Llc
Bought by
Almont Homes Ne Inc
Purchase Details
Closed on
Apr 11, 2012
Sold by
Redus Atlanta Subdivisions
Bought by
Reo Funding Solutions Iii Llc
Purchase Details
Closed on
Jul 6, 2011
Sold by
Prema Bhaskar and Prema Rama
Bought by
Redus Atlanta Subdivisions Llc
Purchase Details
Closed on
Jul 6, 2010
Sold by
Tax Commissioner Of Forsyth Cn
Bought by
Prema Bhaskar and Prema Rama
Create a Home Valuation Report for This Property
The Home Valuation Report is an in-depth analysis detailing your home's value as well as a comparison with similar homes in the area
Home Values in the Area
Average Home Value in this Area
Purchase History
| Date | Buyer | Sale Price | Title Company |
|---|---|---|---|
| Kats Semen | $302,500 | -- | |
| Wilkie Robert D | $308,200 | -- | |
| Almont Homes Ne Inc | $2,436,500 | -- | |
| Reo Funding Solutions Iii Llc | $620,000 | -- | |
| Redus Atlanta Subdivisions Llc | $2,300 | -- | |
| Prema Bhaskar | $2,300 | -- |
Source: Public Records
Mortgage History
| Date | Status | Borrower | Loan Amount |
|---|---|---|---|
| Previous Owner | Wilkie Robert D | $298,954 |
Source: Public Records
Tax History Compared to Growth
Tax History
| Year | Tax Paid | Tax Assessment Tax Assessment Total Assessment is a certain percentage of the fair market value that is determined by local assessors to be the total taxable value of land and additions on the property. | Land | Improvement |
|---|---|---|---|---|
| 2025 | $985 | $217,624 | $56,000 | $161,624 |
| 2024 | $985 | $217,920 | $54,000 | $163,920 |
| 2023 | $887 | $211,408 | $40,000 | $171,408 |
| 2022 | $971 | $129,852 | $30,000 | $99,852 |
| 2021 | $937 | $129,852 | $30,000 | $99,852 |
| 2020 | $900 | $121,000 | $23,200 | $97,800 |
| 2019 | $3,370 | $125,132 | $24,000 | $101,132 |
| 2018 | $3,322 | $123,280 | $27,320 | $95,960 |
| 2017 | $2,502 | $90,160 | $20,000 | $70,160 |
| 2016 | $472 | $20,000 | $20,000 | $0 |
| 2015 | $278 | $10,000 | $10,000 | $0 |
| 2014 | $169 | $6,400 | $6,400 | $0 |
Source: Public Records
Map
Nearby Homes
- 4810 Haysboro Way
- 4085 Sierra Vista Cir
- 4120 Sierra Vista Cir
- 4420 Belcrest Way
- 3810 Sierra Lake Dr
- 3055 Spot Rd
- 3725 Sierra Lake Dr
- 3995 Sierra Lake Dr
- 3940 Twin Lakes Rd
- 4010 Sierra Knolls Ct
- 4230 Jonathan Ln
- 3415 Spot Rd
- 4020 Sierra Knolls Ct
- 2960 Bailey Dr
- 2955 Bailey Dr
- 6260 Dexters Dr
- 6255 Dana Way
- 6230 Dana Way
- 6380 Lake Oak Landing
- 6445 Crystal Ln
- 4870 Belcrest Way
- 4880 Belcrest Way
- 4860 Belcrest Way
- 4865 Belcrest Way
- 4910 Belcrest Way
- 4850 Belcrest Way
- 4855 Belcrest Way
- 4855 Belcrest Way Unit 123
- 4915 Belcrest Way
- 4845 Belcrest Way
- 4845 Belcrest Way Unit 122
- 4920 Belcrest Way
- 4840 Belcrest Way
- 4920 Denton Dr
- 4925 Denton Dr
- 4835 Belcrest Way Unit 121
- 4835 Belcrest Way
- 4925 Belcrest Way
- 4925 Belcrest Way Unit 44
- 4930 Belcrest Way