Estimated Value: $504,000 - $576,000
3
Beds
3
Baths
2,750
Sq Ft
$194/Sq Ft
Est. Value
About This Home
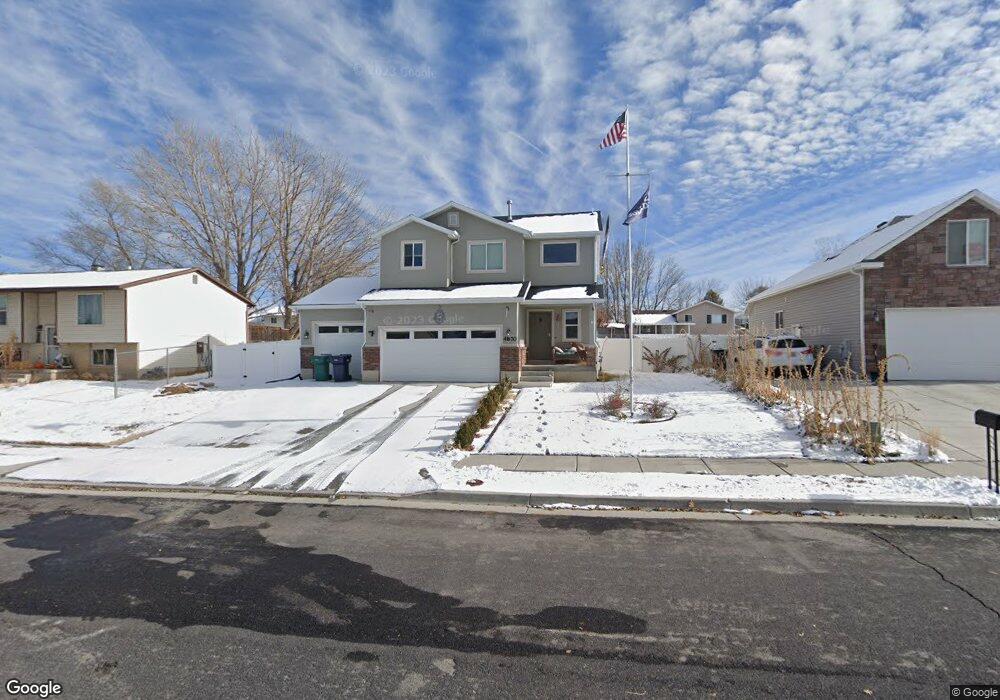
This home is located at 4870 S 3050 W, Roy, UT 84067 and is currently estimated at $534,399, approximately $194 per square foot. 4870 S 3050 W is a home located in Weber County with nearby schools including Midland School, Sand Ridge Junior High School, and Roy High School.
Ownership History
Date
Name
Owned For
Owner Type
Purchase Details
Closed on
Jun 9, 2016
Sold by
Notting Hill Homes Inc
Bought by
Boysen Karsten
Current Estimated Value
Home Financials for this Owner
Home Financials are based on the most recent Mortgage that was taken out on this home.
Original Mortgage
$292,128
Outstanding Balance
$233,181
Interest Rate
3.66%
Mortgage Type
VA
Estimated Equity
$301,218
Purchase Details
Closed on
Sep 9, 2010
Sold by
Tab Llc
Bought by
Life Builders Llc
Purchase Details
Closed on
Aug 31, 2010
Sold by
Russell Farm Estates Llc
Bought by
Tab Llc
Create a Home Valuation Report for This Property
The Home Valuation Report is an in-depth analysis detailing your home's value as well as a comparison with similar homes in the area
Home Values in the Area
Average Home Value in this Area
Purchase History
| Date | Buyer | Sale Price | Title Company |
|---|---|---|---|
| Boysen Karsten | -- | Mountain View Title | |
| Life Builders Llc | -- | Legendstitle Llc | |
| Tab Llc | -- | None Available |
Source: Public Records
Mortgage History
| Date | Status | Borrower | Loan Amount |
|---|---|---|---|
| Open | Boysen Karsten | $292,128 |
Source: Public Records
Tax History Compared to Growth
Tax History
| Year | Tax Paid | Tax Assessment Tax Assessment Total Assessment is a certain percentage of the fair market value that is determined by local assessors to be the total taxable value of land and additions on the property. | Land | Improvement |
|---|---|---|---|---|
| 2025 | $3,202 | $516,924 | $142,844 | $374,080 |
| 2024 | $3,063 | $273,349 | $78,564 | $194,785 |
| 2023 | $2,954 | $264,000 | $68,988 | $195,012 |
| 2022 | $3,219 | $297,550 | $59,197 | $238,353 |
| 2021 | $2,513 | $380,000 | $80,658 | $299,342 |
| 2020 | $2,363 | $328,000 | $80,658 | $247,342 |
| 2019 | $2,329 | $305,000 | $49,820 | $255,180 |
| 2018 | $2,281 | $282,000 | $49,820 | $232,180 |
| 2017 | $2,204 | $256,000 | $49,820 | $206,180 |
| 2016 | $2,227 | $139,833 | $23,685 | $116,148 |
| 2015 | $797 | $43,063 | $43,063 | $0 |
| 2014 | $615 | $43,063 | $43,063 | $0 |
Source: Public Records
Map
Nearby Homes
- 3046 W 4850 S
- 4918 S 2925 W
- 5009 S 2925 W
- 4891 S 2875 W
- 5003 S 2825 W
- 3014 W 4750 S
- 5063 S 2825 W
- 3171 W 4725 S
- 5056 S 2800 W
- 4635 S 2950 W
- 4964 S 3375 W
- 4919 S 2675 W
- 4875 S 2675 W
- 5321 S 3100 W
- 4553 Trailside Dr
- 3509 W 4835 S Unit 26
- 3443 W 5200 S Unit 2&3
- 3523 W 4835 S Unit 28
- 3524 W 4835 S Unit 22
- 5432 S 3150 W