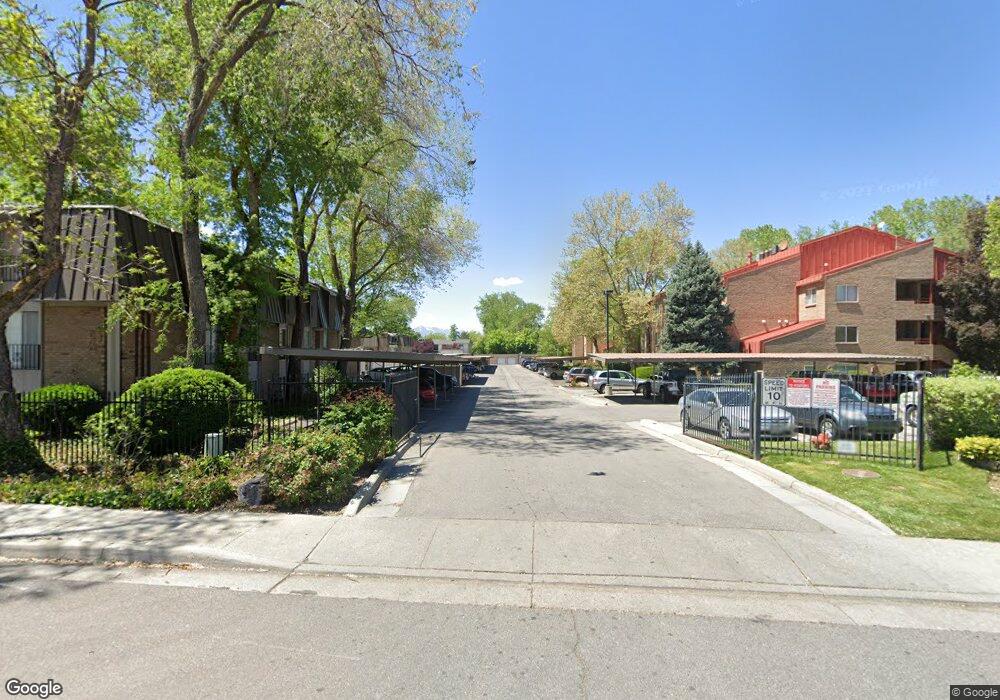
4870 S Highland Cir Unit 3 Holladay, UT 84117
Estimated Value: $271,000 - $278,071
2
Beds
1
Bath
875
Sq Ft
$314/Sq Ft
Est. Value
About This Home
This home is located at 4870 S Highland Cir Unit 3, Holladay, UT 84117 and is currently estimated at $274,768, approximately $314 per square foot. 4870 S Highland Cir Unit 3 is a home located in Salt Lake County with nearby schools including Oakwood Elementary School, Bonneville Junior High School, and Cottonwood High School.
Ownership History
Date
Name
Owned For
Owner Type
Purchase Details
Closed on
Jun 3, 2020
Sold by
Aeg Llc
Bought by
Asmussen Tahna
Current Estimated Value
Home Financials for this Owner
Home Financials are based on the most recent Mortgage that was taken out on this home.
Original Mortgage
$171,950
Outstanding Balance
$152,421
Interest Rate
3.2%
Mortgage Type
New Conventional
Estimated Equity
$122,347
Purchase Details
Closed on
Nov 27, 2018
Sold by
Muir Mark E and Muir Lynn E
Bought by
A E G Llc
Home Financials for this Owner
Home Financials are based on the most recent Mortgage that was taken out on this home.
Original Mortgage
$85,500
Interest Rate
4.8%
Mortgage Type
New Conventional
Purchase Details
Closed on
Nov 26, 2018
Sold by
Mittanck Properties Llc
Bought by
Muir Mark E and Muir Lynn E
Home Financials for this Owner
Home Financials are based on the most recent Mortgage that was taken out on this home.
Original Mortgage
$85,500
Interest Rate
4.8%
Mortgage Type
New Conventional
Purchase Details
Closed on
May 2, 2013
Sold by
Kasey Enterprises Inc
Bought by
Mittanck Properties Llc
Home Financials for this Owner
Home Financials are based on the most recent Mortgage that was taken out on this home.
Original Mortgage
$80,500
Interest Rate
3.5%
Mortgage Type
New Conventional
Purchase Details
Closed on
Jan 11, 2012
Sold by
Klc Thomas J
Bought by
Kasey Enterprises Inc
Purchase Details
Closed on
Apr 13, 2005
Sold by
Service Specialties Inc
Bought by
Cfr Investment Llc
Home Financials for this Owner
Home Financials are based on the most recent Mortgage that was taken out on this home.
Original Mortgage
$1,996,650
Interest Rate
5.84%
Mortgage Type
Seller Take Back
Purchase Details
Closed on
Apr 8, 2005
Sold by
Iverson Properties Lc
Bought by
Service Specialties Inc and Iverson Properties Lc
Home Financials for this Owner
Home Financials are based on the most recent Mortgage that was taken out on this home.
Original Mortgage
$1,996,650
Interest Rate
5.84%
Mortgage Type
Seller Take Back
Purchase Details
Closed on
Oct 1, 1998
Sold by
Klc Thomas J
Bought by
Iverson Properties L C
Purchase Details
Closed on
Feb 7, 1997
Sold by
Iverson Properties Lc
Bought by
Madison Gary Lee and Madison Margaret A
Home Financials for this Owner
Home Financials are based on the most recent Mortgage that was taken out on this home.
Original Mortgage
$88,200
Interest Rate
7.62%
Mortgage Type
Purchase Money Mortgage
Create a Home Valuation Report for This Property
The Home Valuation Report is an in-depth analysis detailing your home's value as well as a comparison with similar homes in the area
Home Values in the Area
Average Home Value in this Area
Purchase History
| Date | Buyer | Sale Price | Title Company |
|---|---|---|---|
| Asmussen Tahna | -- | Sutherland Title | |
| A E G Llc | -- | Citadel Title & Escrow | |
| Muir Mark E | -- | Benchmark Title Ins Agency | |
| Mittanck Properties Llc | -- | Benchmark Title Ins Ag | |
| Kasey Enterprises Inc | -- | None Available | |
| Cfr Investment Llc | -- | First American Title | |
| Service Specialties Inc | -- | First American Title | |
| Iverson Properties L C | -- | -- | |
| Madison Gary Lee | -- | -- |
Source: Public Records
Mortgage History
| Date | Status | Borrower | Loan Amount |
|---|---|---|---|
| Open | Asmussen Tahna | $171,950 | |
| Previous Owner | Muir Mark E | $85,500 | |
| Previous Owner | Mittanck Properties Llc | $80,500 | |
| Previous Owner | Cfr Investment Llc | $1,996,650 | |
| Previous Owner | Madison Gary Lee | $88,200 | |
| Closed | Cfr Investment Llc | $1,000,000 |
Source: Public Records
Tax History Compared to Growth
Tax History
| Year | Tax Paid | Tax Assessment Tax Assessment Total Assessment is a certain percentage of the fair market value that is determined by local assessors to be the total taxable value of land and additions on the property. | Land | Improvement |
|---|---|---|---|---|
| 2025 | $1,391 | $251,600 | $75,500 | $176,100 |
| 2024 | $1,391 | $251,700 | $75,500 | $176,200 |
| 2023 | $1,382 | $243,800 | $73,100 | $170,700 |
| 2022 | $1,343 | $238,100 | $71,400 | $166,700 |
| 2021 | $1,156 | $178,000 | $53,400 | $124,600 |
| 2020 | $1,017 | $155,300 | $46,600 | $108,700 |
| 2019 | $985 | $146,400 | $43,900 | $102,500 |
| 2018 | $906 | $130,300 | $39,100 | $91,200 |
| 2017 | $740 | $112,300 | $33,700 | $78,600 |
| 2016 | $667 | $101,800 | $30,500 | $71,300 |
| 2015 | $681 | $97,000 | $29,100 | $67,900 |
| 2014 | $685 | $96,000 | $28,800 | $67,200 |
Source: Public Records
Map
Nearby Homes
- 4878 S Highland Cir Unit 6
- 4852 S Highland Cir Unit 6
- 4828 Brooks Way
- 1697 E Woodbridge Dr Unit 4
- 1920 E Rodeo Walk Dr Unit 510
- 1920 E Rodeo Walk Dr Unit 508
- 1617 Meadowmoor Rd
- 1578 E 4945 S
- 5100 Woodmont Dr
- 1968 E Sycamore Ln
- 2174 E Rising Wolf Lane Ln Unit 17
- 1747 E Water Pine Ct S Unit 101
- 4865 S Wallace Ln E
- 1894 Southmoor Dr
- 5037 S Cotton Tree Ln
- 4972 Boabab Cir
- 1872 E 5150 S
- 5072 Boabab Dr
- 1365 E Foxmont Ln
- 4856 S Colony Cir
- 4870 S Highland Cir Unit 6
- 4870 S Highland Cir Unit 4
- 4870 S Highland Cir Unit 3
- 4870 S Highland Cir Unit 2
- 4870 S Highland Cir Unit 1
- 4870 S Highland Cir Unit 5
- 4870 S Highland Cir Unit 4
- 4870 S Highland Cir Unit 6
- 4870 S Highland Cir Unit 3
- 4870 S Highland Cir Unit 5
- 4870 S Highland Cir Unit 4
- 4870 S Highland Cir Unit 1
- 4870 S Highland Cir
- 4870 S Highland Cir Unit 5
- 4870 S Highland Cir Unit 6
- 4870 S Highland Cir Unit 2
- 4872 S Highland Cir Unit 3
- 4872 S Highland Cir Unit 4
- 4872 S Highland Cir Unit E3
- 4872 S Highland Cir