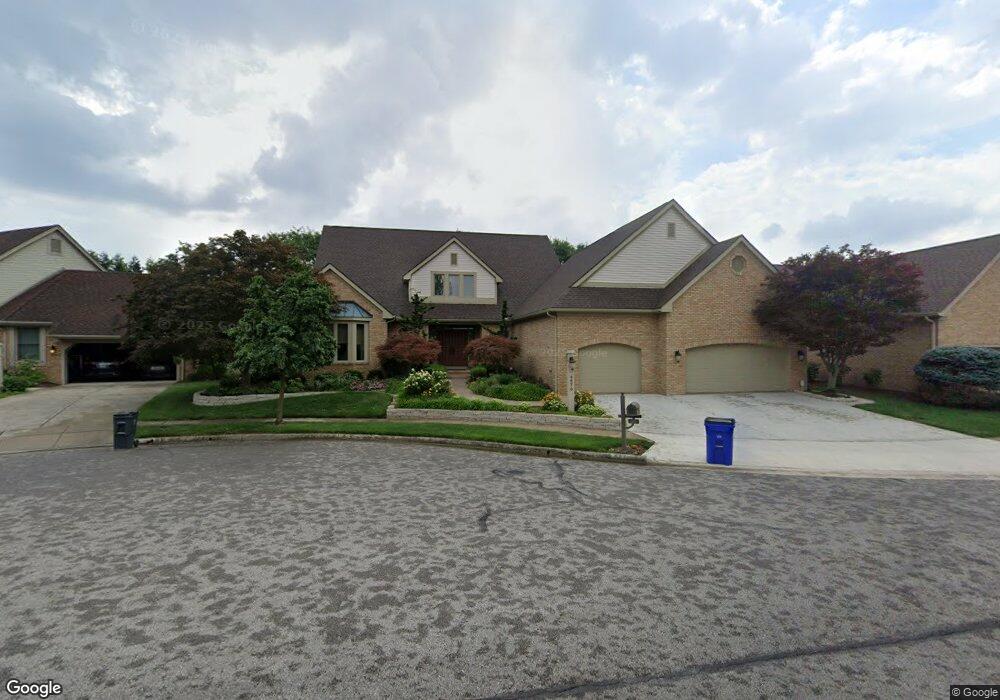
4870 Shackelford Ct Columbus, OH 43220
Estimated Value: $853,876 - $1,205,000
3
Beds
5
Baths
4,237
Sq Ft
$241/Sq Ft
Est. Value
About This Home
This home is located at 4870 Shackelford Ct, Columbus, OH 43220 and is currently estimated at $1,022,959, approximately $241 per square foot. 4870 Shackelford Ct is a home located in Franklin County with nearby schools including Greensview Elementary School, Hastings Middle School, and Upper Arlington High School.
Ownership History
Date
Name
Owned For
Owner Type
Purchase Details
Closed on
Feb 27, 2020
Sold by
Ilt Holdings Llc
Bought by
Khourie William N and Khourie Lisa K
Current Estimated Value
Purchase Details
Closed on
Jun 11, 2009
Sold by
Revocab Thomas Lorraine and Lorraine Thomas 2000 Revocab I
Bought by
Ilt Holdings Llc
Purchase Details
Closed on
Jul 13, 2002
Sold by
Kennedy Anita M
Bought by
Revocab Thomas I Lorraine and Lorraine Thomas 2000 Revocab I
Purchase Details
Closed on
Oct 19, 2000
Sold by
Horton Carl and Horton Judith
Bought by
Kennedy Anita M
Home Financials for this Owner
Home Financials are based on the most recent Mortgage that was taken out on this home.
Original Mortgage
$700,000
Interest Rate
7.96%
Purchase Details
Closed on
Apr 27, 1989
Bought by
Horton Carl and Horton Judith
Create a Home Valuation Report for This Property
The Home Valuation Report is an in-depth analysis detailing your home's value as well as a comparison with similar homes in the area
Home Values in the Area
Average Home Value in this Area
Purchase History
| Date | Buyer | Sale Price | Title Company |
|---|---|---|---|
| Khourie William N | $775,000 | None Available | |
| Ilt Holdings Llc | -- | Attorney | |
| Revocab Thomas I Lorraine | $750,000 | Lawyers Title | |
| Kennedy Anita M | $650,000 | Lawyers Title | |
| Horton Carl | $381,100 | -- |
Source: Public Records
Mortgage History
| Date | Status | Borrower | Loan Amount |
|---|---|---|---|
| Previous Owner | Kennedy Anita M | $700,000 |
Source: Public Records
Tax History Compared to Growth
Tax History
| Year | Tax Paid | Tax Assessment Tax Assessment Total Assessment is a certain percentage of the fair market value that is determined by local assessors to be the total taxable value of land and additions on the property. | Land | Improvement |
|---|---|---|---|---|
| 2024 | $16,398 | $280,460 | $12,250 | $268,210 |
| 2023 | $16,035 | $280,460 | $12,250 | $268,210 |
| 2022 | $17,543 | $251,060 | $21,000 | $230,060 |
| 2021 | $15,530 | $251,060 | $21,000 | $230,060 |
| 2020 | $15,745 | $251,060 | $21,000 | $230,060 |
| 2019 | $17,069 | $240,590 | $17,500 | $223,090 |
| 2018 | $8,489 | $240,590 | $17,500 | $223,090 |
| 2017 | $16,499 | $240,590 | $17,500 | $223,090 |
| 2016 | $16,004 | $234,960 | $34,230 | $200,730 |
| 2015 | $7,970 | $234,960 | $34,230 | $200,730 |
| 2014 | $15,958 | $234,960 | $34,230 | $200,730 |
| 2013 | $8,032 | $223,755 | $32,585 | $191,170 |
Source: Public Records
Map
Nearby Homes
- 2165 Partlow Dr
- 2198 Sandston Rd
- 4781 Coach Rd
- 2231 Atlee Ct Unit 12
- 4861 Etrick Dr Unit 22
- 2248 Sandover Rd
- 2060 Fontenay Place
- 4740 Merrifield Place Unit 25
- 4720 Merrifield Place Unit 67
- 1865 Willoway Cir N Unit 1865
- 1835 Willoway Cir N
- 4450 Haverford Ct
- 5268 Captains Ct
- 1961 Ramble Branch Dr Unit 30
- 4924 Reed Rd Unit B
- 5000 Slate Run Woods Ct
- 2172 Hedgerow Rd Unit 2172G
- 5283 Ruthton Rd Unit 19
- 2560 Chartwell Rd
- 5244 Greensedge Way Unit 12
- 4870 Shackleford Ct
- 4860 Shackleford Ct
- 4876 Shackleford Ct Unit 4876
- 4856 Shackleford Ct
- 4856 Shackelford Ct
- 4880 Shackleford Ct Unit 4880
- 4876 Shackelford Ct
- 4880 Shackelford Ct
- 4850 Shackleford Ct
- 4886 Shackelford Ct
- 4886 Shackleford Ct
- 4890 Shackelford Ct
- 4867 Dierker Rd
- 4846 Shackleford Ct Unit 4846
- 4846 Shackelford Ct
- 4877 Shackleford Ct
- 4877 Shackelford Ct
- 4885 Shackleford Ct Unit 4885
- 2140 Partlow Dr