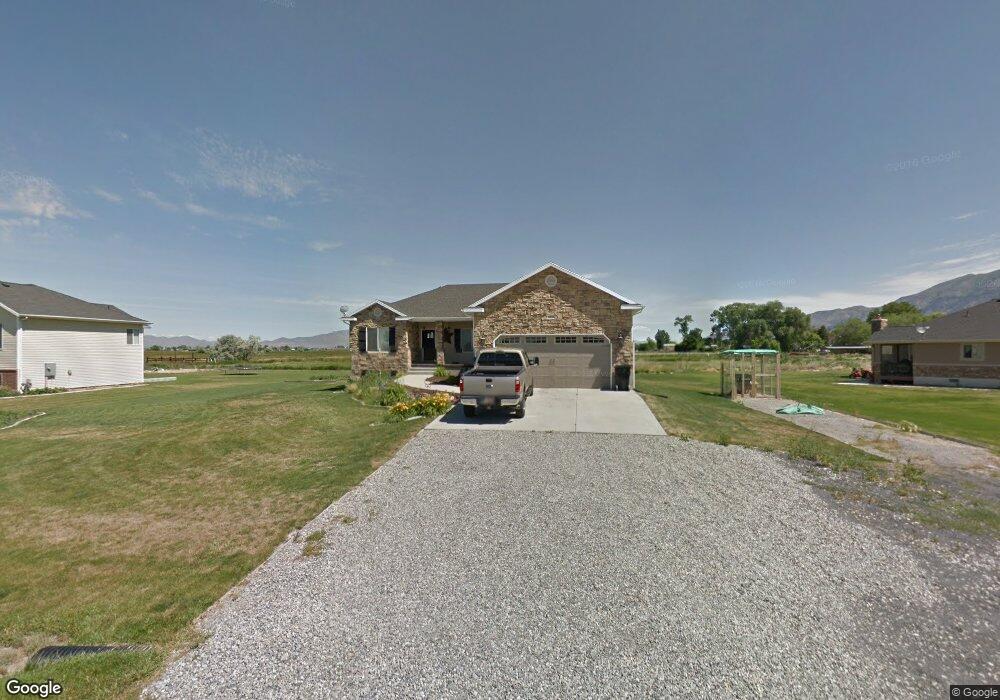
4870 W 5680 N Bear River City, UT 84301
Estimated Value: $534,000 - $648,400
6
Beds
3
Baths
3,246
Sq Ft
$188/Sq Ft
Est. Value
About This Home
This home is located at 4870 W 5680 N, Bear River City, UT 84301 and is currently estimated at $611,600, approximately $188 per square foot. 4870 W 5680 N is a home located in Box Elder County with nearby schools including Century School, Bear River Middle School, and Alice C. Harris Intermediate School.
Ownership History
Date
Name
Owned For
Owner Type
Purchase Details
Closed on
Mar 23, 2018
Sold by
Stoering Brian D and Stoering Kellee F
Bought by
Johnson Brent G
Current Estimated Value
Home Financials for this Owner
Home Financials are based on the most recent Mortgage that was taken out on this home.
Original Mortgage
$321,575
Outstanding Balance
$275,171
Interest Rate
4.32%
Mortgage Type
New Conventional
Estimated Equity
$336,429
Purchase Details
Closed on
Nov 16, 2011
Sold by
Craynor Bret W and Craynor Marianne
Bought by
Stoering Brian D and Stoering Kellie F
Home Financials for this Owner
Home Financials are based on the most recent Mortgage that was taken out on this home.
Original Mortgage
$218,700
Interest Rate
4.09%
Mortgage Type
New Conventional
Create a Home Valuation Report for This Property
The Home Valuation Report is an in-depth analysis detailing your home's value as well as a comparison with similar homes in the area
Home Values in the Area
Average Home Value in this Area
Purchase History
| Date | Buyer | Sale Price | Title Company |
|---|---|---|---|
| Johnson Brent G | -- | American Secure Title Brigha | |
| Stoering Brian D | -- | American Secure Title |
Source: Public Records
Mortgage History
| Date | Status | Borrower | Loan Amount |
|---|---|---|---|
| Open | Johnson Brent G | $321,575 | |
| Previous Owner | Stoering Brian D | $218,700 |
Source: Public Records
Tax History Compared to Growth
Tax History
| Year | Tax Paid | Tax Assessment Tax Assessment Total Assessment is a certain percentage of the fair market value that is determined by local assessors to be the total taxable value of land and additions on the property. | Land | Improvement |
|---|---|---|---|---|
| 2025 | $2,576 | $568,583 | $130,000 | $438,583 |
| 2024 | $2,576 | $562,911 | $125,000 | $437,911 |
| 2023 | $2,758 | $611,700 | $145,000 | $466,700 |
| 2022 | $2,597 | $296,236 | $26,675 | $269,561 |
| 2021 | $2,188 | $381,765 | $48,500 | $333,265 |
| 2020 | $2,157 | $381,765 | $48,500 | $333,265 |
| 2019 | $2,030 | $186,217 | $24,008 | $162,209 |
| 2018 | $1,338 | $114,815 | $24,008 | $90,807 |
| 2017 | $1,387 | $208,754 | $24,008 | $165,104 |
| 2016 | $1,371 | $110,491 | $24,008 | $86,483 |
| 2015 | $1,250 | $102,629 | $24,008 | $78,621 |
| 2014 | $1,250 | $98,885 | $24,008 | $74,877 |
| 2013 | -- | $98,885 | $24,008 | $74,877 |
Source: Public Records
Map
Nearby Homes
- 4846 W 5680 N
- 6074 N 4700 St W
- 4798 W 6000 N
- 4555 Iowa String Rd
- 6975 N 2650 W
- 8185 N 4600 W
- 7155 N 2350 W
- 8325 N 3600 W
- 1930 W 5900 N
- 2880 Mule Ranch Rd
- 5200 N Highway 38
- 2779 N 3150 W
- 4693 W 9120 N
- 2315 N 4160 W
- 2294 N 3950 W
- 2386 N 3900 W
- 9190 N 6000 W
- 9270 N 5600 W Unit 7
- 9290 N 5600 W Unit 5
- 3970 Arizona St