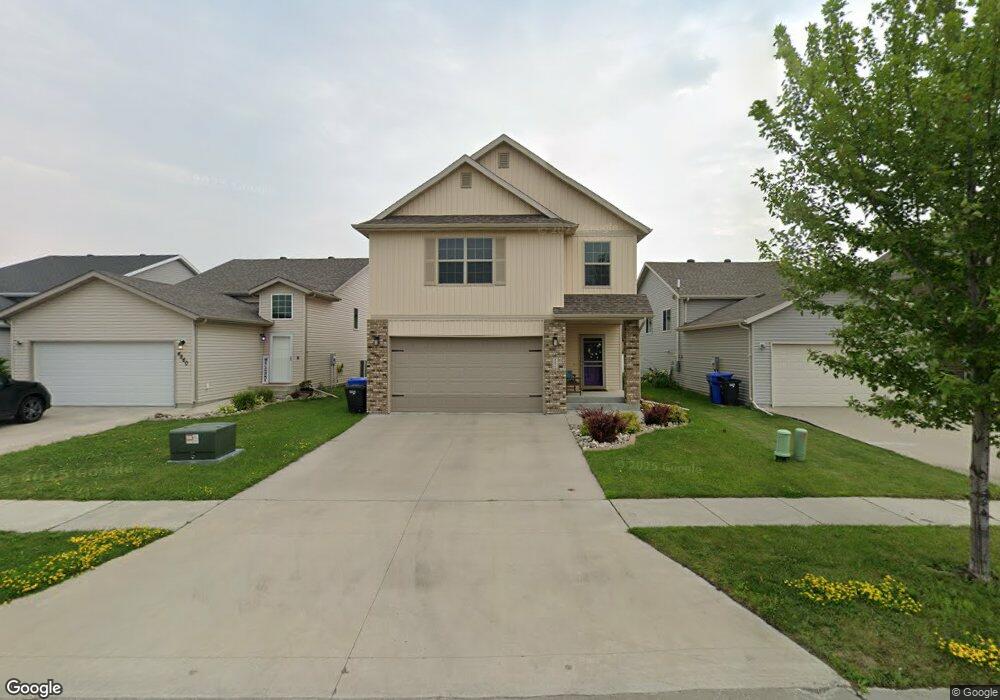
4872 54th St S Fargo, ND 58104
Osgood NeighborhoodEstimated Value: $342,627 - $393,000
3
Beds
3
Baths
2,011
Sq Ft
$179/Sq Ft
Est. Value
About This Home
This home is located at 4872 54th St S, Fargo, ND 58104 and is currently estimated at $359,407, approximately $178 per square foot. 4872 54th St S is a home located in Cass County with nearby schools including Osgood Elementary School, Liberty Middle School, and West Fargo Sheyenne High School.
Ownership History
Date
Name
Owned For
Owner Type
Purchase Details
Closed on
May 7, 2020
Sold by
Reber Amanda B and Reber Brandon
Bought by
Lass Levi and Richardson Megan Joyce
Current Estimated Value
Home Financials for this Owner
Home Financials are based on the most recent Mortgage that was taken out on this home.
Original Mortgage
$247,350
Outstanding Balance
$219,186
Interest Rate
3.3%
Mortgage Type
New Conventional
Estimated Equity
$140,221
Purchase Details
Closed on
Jul 5, 2011
Sold by
Dabbert Custom Homes Llc
Bought by
Hewson Amanda B
Home Financials for this Owner
Home Financials are based on the most recent Mortgage that was taken out on this home.
Original Mortgage
$149,452
Interest Rate
4.63%
Mortgage Type
VA
Purchase Details
Closed on
Feb 15, 2011
Sold by
Jetland Properties Llc
Bought by
Dabbert Custom Homes Llc
Purchase Details
Closed on
Feb 14, 2011
Sold by
Rocking Horse Farm Llc
Bought by
Jetland Properties Llc
Create a Home Valuation Report for This Property
The Home Valuation Report is an in-depth analysis detailing your home's value as well as a comparison with similar homes in the area
Home Values in the Area
Average Home Value in this Area
Purchase History
| Date | Buyer | Sale Price | Title Company |
|---|---|---|---|
| Lass Levi | $255,000 | The Title Company | |
| Hewson Amanda B | $145,950 | Trn Asbtract And Title | |
| Dabbert Custom Homes Llc | -- | -- | |
| Jetland Properties Llc | -- | -- |
Source: Public Records
Mortgage History
| Date | Status | Borrower | Loan Amount |
|---|---|---|---|
| Open | Lass Levi | $247,350 | |
| Previous Owner | Hewson Amanda B | $149,452 |
Source: Public Records
Tax History
| Year | Tax Paid | Tax Assessment Tax Assessment Total Assessment is a certain percentage of the fair market value that is determined by local assessors to be the total taxable value of land and additions on the property. | Land | Improvement |
|---|---|---|---|---|
| 2024 | $4,723 | $156,850 | $20,250 | $136,600 |
| 2023 | $5,036 | $150,800 | $17,200 | $133,600 |
| 2022 | $4,846 | $137,100 | $17,200 | $119,900 |
| 2021 | $4,561 | $124,650 | $17,200 | $107,450 |
| 2020 | $4,500 | $124,650 | $17,200 | $107,450 |
| 2019 | $4,407 | $124,650 | $9,550 | $115,100 |
| 2018 | $4,303 | $124,650 | $9,550 | $115,100 |
| 2017 | $3,978 | $114,200 | $9,550 | $104,650 |
| 2016 | $3,563 | $106,750 | $9,550 | $97,200 |
| 2015 | $3,673 | $106,750 | $7,150 | $99,600 |
| 2014 | $3,362 | $88,650 | $7,150 | $81,500 |
| 2013 | $1,442 | $9,450 | $7,150 | $2,300 |
Source: Public Records
Map
Nearby Homes
- 5284 49th Ave S
- 5265 50th Ave S
- 4778 53rd St S
- 5491 49th Ave S
- 4743 Harvest Dr S
- 4985 55th St S
- 5217 47th Ave S
- 4486 53rd St S
- 4868 Bluebell Loop S
- 4615 Beach Ln S Unit 2B
- 5861 Wildflower Dr S
- 4804 51st Ave S
- 4304 Estate Dr S
- 6023 Wildflower Dr S
- 6090 Wildflower Dr S
- 6152 Wildflower Dr
- 4797 Clock Tower Ln S
- 9350 & 9124 57th St S
- 4127 52nd St S
- 4110 52nd St S
- 4884 54th St S
- 4860 54th St S
- 4848 54th St S
- 4896 54th St S
- 4836 54th St S
- 4873 53rd St S
- 4855 53rd St S
- 4889 53rd St S
- 5403 49th Ave S
- 4824 54th St S
- 4843 53rd St S
- 4895 53rd St S
- 5409 49th Ave S
- 4837 53rd St S
- 4812 54th St S
- 5406 48th Ave S
- 4831 53rd St S
- 5417 49th Ave S
- 4800 54th St S
- 5394 49th Ave S
Your Personal Tour Guide
Ask me questions while you tour the home.