Estimated Value: $622,000 - $803,000
5
Beds
4
Baths
2,730
Sq Ft
$253/Sq Ft
Est. Value
About This Home
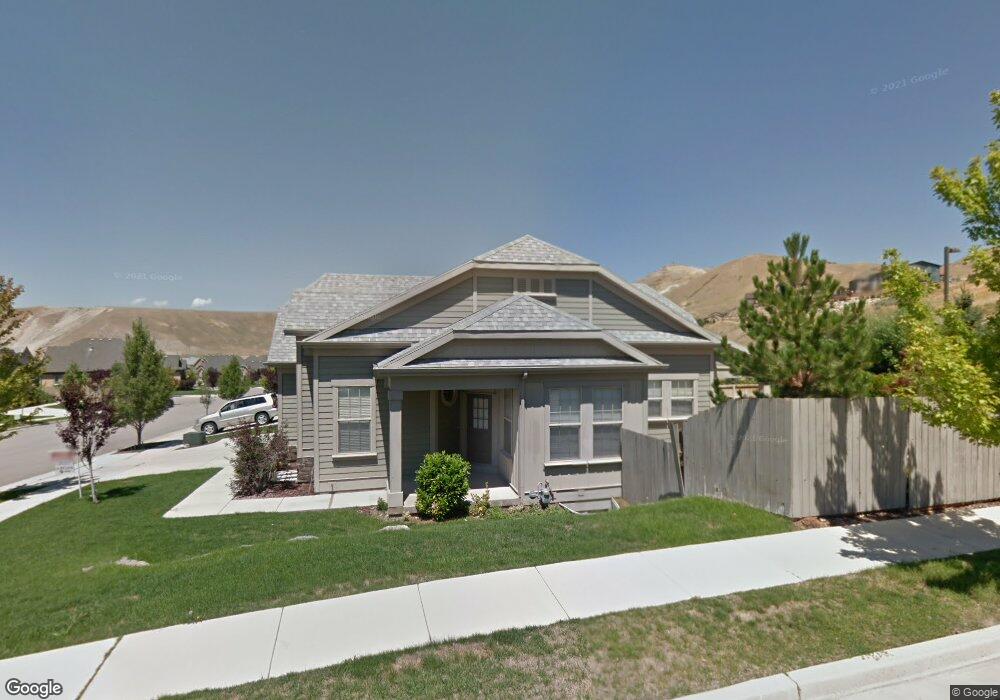
This home is located at 4872 N Shady View Ln, Lehi, UT 84043 and is currently estimated at $689,699, approximately $252 per square foot. 4872 N Shady View Ln is a home located in Utah County with nearby schools including Traverse Mountain Elementary School, Skyridge High School, and Ignite Entrepreneurship Academy.
Ownership History
Date
Name
Owned For
Owner Type
Purchase Details
Closed on
Mar 10, 2014
Sold by
Boswell Gentry
Bought by
Grb 4872 Llc
Current Estimated Value
Purchase Details
Closed on
Jun 20, 2007
Sold by
Porto Tiffany L and Dahl James G
Bought by
Boswell Gentry
Purchase Details
Closed on
Jan 26, 2007
Sold by
Jimmy Zufelt Construction Inc
Bought by
Porto Tiffany L and Dahl James G
Home Financials for this Owner
Home Financials are based on the most recent Mortgage that was taken out on this home.
Original Mortgage
$241,552
Interest Rate
7.75%
Mortgage Type
New Conventional
Create a Home Valuation Report for This Property
The Home Valuation Report is an in-depth analysis detailing your home's value as well as a comparison with similar homes in the area
Home Values in the Area
Average Home Value in this Area
Purchase History
| Date | Buyer | Sale Price | Title Company |
|---|---|---|---|
| Grb 4872 Llc | -- | None Available | |
| Boswell Gentry | -- | Equity Title Insurance Agen | |
| Porto Tiffany L | -- | Empire Land Title Company |
Source: Public Records
Mortgage History
| Date | Status | Borrower | Loan Amount |
|---|---|---|---|
| Previous Owner | Porto Tiffany L | $241,552 |
Source: Public Records
Tax History Compared to Growth
Tax History
| Year | Tax Paid | Tax Assessment Tax Assessment Total Assessment is a certain percentage of the fair market value that is determined by local assessors to be the total taxable value of land and additions on the property. | Land | Improvement |
|---|---|---|---|---|
| 2025 | $2,562 | $322,850 | $213,700 | $373,300 |
| 2024 | $2,562 | $299,805 | $0 | $0 |
| 2023 | $2,379 | $302,225 | $0 | $0 |
| 2022 | $2,489 | $306,625 | $0 | $0 |
| 2021 | $2,238 | $416,800 | $123,700 | $293,100 |
| 2020 | $2,110 | $388,400 | $114,500 | $273,900 |
| 2019 | $1,867 | $357,300 | $114,500 | $242,800 |
| 2018 | $1,801 | $325,800 | $107,600 | $218,200 |
| 2017 | $1,715 | $164,945 | $0 | $0 |
| 2016 | $1,702 | $151,855 | $0 | $0 |
| 2015 | $1,702 | $144,155 | $0 | $0 |
| 2014 | $1,587 | $133,650 | $0 | $0 |
Source: Public Records
Map
Nearby Homes
- 4901 N Eagle Nest Ln
- 4665 N Stonehaven Loop
- 5047 N Larkwood Ln
- 4420 N Buckstone Way Unit 1085
- 4426 N Buckstone Way Unit 1086
- 4432 N Buckstone Way Unit 1087
- 4438 N Buckstone Way Unit 1088
- 4923 N Marble Fox Way Unit 124
- 4685 N Pheasant Ridge Trail
- 4852 N Arctic Fox Cir
- 5183 Fox Hollow Way
- 5217 N Fox Hollow Way
- Vistas Townhomes (Unita) Plan at Vistas Townhomes in Lehi - Vistas Townhomes
- Vistas Townhome (Wasatch) Plan at Vistas Townhomes in Lehi - Vistas Townhomes
- 2780 Fox Hunters Loop
- 5034 N Marble Fox Way
- 6197 N Fox Rd
- 5381 N Eagles View Dr
- 2297 W New Harvest Ln
- 2278 W Granite Arch Way
- 4882 N Shady View Ln
- 4892 N Shady View Ln
- 4848 N Shady View Ln
- 2802 W After Glow Ln
- 4859 N Shady View Ln
- 4873 N Shady View Ln
- 4904 N Shady View Ln
- 4901 N Nile Dr Unit 26
- 4901 N Nile Dr
- 4832 N Shady View Ln
- 4887 N Shady View Ln
- 4841 N Shady View Ln
- 4905 N Nile Dr Unit 27
- 4891 N Nile Dr
- 4909 N Nile Dr Unit 28
- 2814 W After Glow Ln
- 4887 N Nile Dr Unit 5
- 4913 N Nile Dr Unit 29
- 4916 N Shady View Ln
- 4816 N Shady View Ln