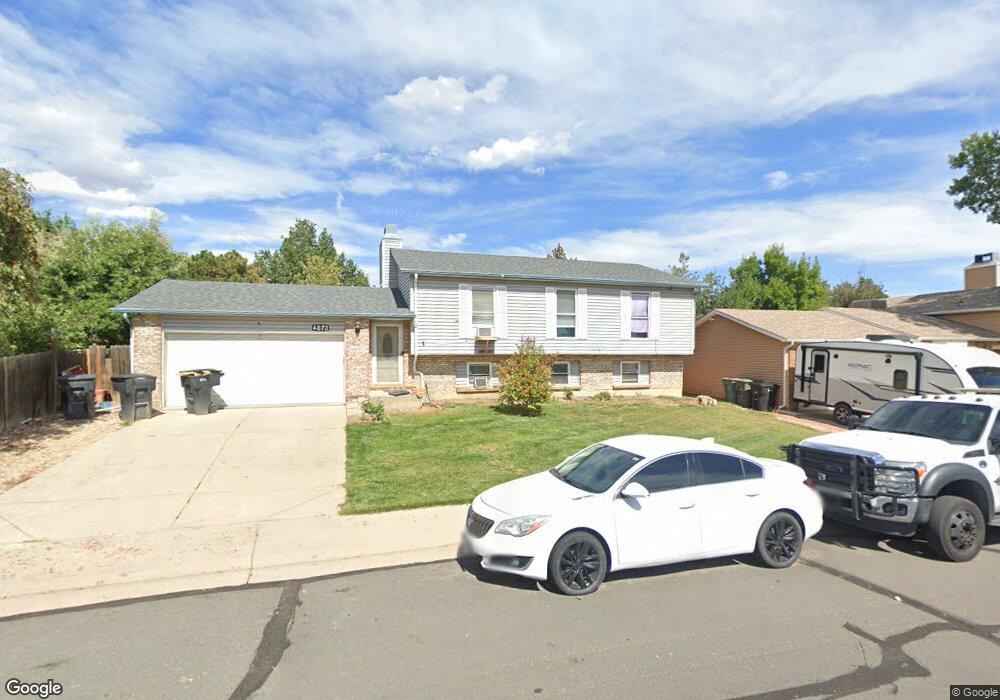
4873 E 111th Place Thornton, CO 80233
Grange Creek NeighborhoodEstimated Value: $465,000 - $504,000
4
Beds
2
Baths
1,885
Sq Ft
$254/Sq Ft
Est. Value
About This Home
This home is located at 4873 E 111th Place, Thornton, CO 80233 and is currently estimated at $478,961, approximately $254 per square foot. 4873 E 111th Place is a home located in Adams County with nearby schools including Riverdale Elementary School, Shadow Ridge Middle School, and Thornton High School.
Ownership History
Date
Name
Owned For
Owner Type
Purchase Details
Closed on
Feb 6, 2006
Sold by
Mcclain William L
Bought by
Mcclain William L and Mcclain Melinda A
Current Estimated Value
Home Financials for this Owner
Home Financials are based on the most recent Mortgage that was taken out on this home.
Original Mortgage
$208,050
Outstanding Balance
$120,154
Interest Rate
6.64%
Mortgage Type
Unknown
Estimated Equity
$358,807
Purchase Details
Closed on
Jul 21, 2003
Sold by
Mcclain Melinda and Mcclain William L
Bought by
Mcclain William L
Home Financials for this Owner
Home Financials are based on the most recent Mortgage that was taken out on this home.
Original Mortgage
$168,300
Interest Rate
7.2%
Mortgage Type
Unknown
Purchase Details
Closed on
Oct 2, 1991
Create a Home Valuation Report for This Property
The Home Valuation Report is an in-depth analysis detailing your home's value as well as a comparison with similar homes in the area
Home Values in the Area
Average Home Value in this Area
Purchase History
| Date | Buyer | Sale Price | Title Company |
|---|---|---|---|
| Mcclain William L | -- | Archer Land Title Inc | |
| Mcclain William L | -- | Chicago Title Co | |
| -- | $77,200 | -- |
Source: Public Records
Mortgage History
| Date | Status | Borrower | Loan Amount |
|---|---|---|---|
| Open | Mcclain William L | $208,050 | |
| Closed | Mcclain William L | $168,300 |
Source: Public Records
Tax History Compared to Growth
Tax History
| Year | Tax Paid | Tax Assessment Tax Assessment Total Assessment is a certain percentage of the fair market value that is determined by local assessors to be the total taxable value of land and additions on the property. | Land | Improvement |
|---|---|---|---|---|
| 2024 | $3,011 | $28,570 | $5,940 | $22,630 |
| 2023 | $2,981 | $32,810 | $6,090 | $26,720 |
| 2022 | $2,644 | $23,230 | $5,700 | $17,530 |
| 2021 | $2,644 | $23,230 | $5,700 | $17,530 |
| 2020 | $2,496 | $22,370 | $5,860 | $16,510 |
| 2019 | $2,501 | $22,370 | $5,860 | $16,510 |
| 2018 | $2,252 | $19,570 | $5,760 | $13,810 |
| 2017 | $2,048 | $19,570 | $5,760 | $13,810 |
| 2016 | $1,735 | $16,140 | $3,260 | $12,880 |
| 2015 | $1,732 | $16,140 | $3,260 | $12,880 |
| 2014 | -- | $12,680 | $2,550 | $10,130 |
Source: Public Records
Map
Nearby Homes
- 11171 Forest Ave
- 5056 E 112th Ct
- 4993 E 111th Place
- 5055 E 112th Ct
- 4807 E 110th Place
- 11068 Eudora Cir
- 11062 Fairfax Cir
- 11135 Clermont Dr
- 4520 E 112th Place
- 5303 E 113th Place
- 11279 Holly St
- 10985 Glencoe Place
- 10895 Fairfax Way
- 11343 Grape Cir
- 10899 Grange Creek Dr
- 10979 Grange Creek Dr
- 4346 E 113th Place
- 10992 Albion Cir
- 11354 Jersey St
- 3916 E 113th Ave
- 4893 E 111th Place
- 4853 E 111th Place
- 4903 E 111th Place
- 11193 Forest Ave
- 4833 E 111th Place
- 5042 E 112th Place
- 5034 E 112th Place
- 11132 Dahlia Way
- 5050 E 112th Place
- 5026 E 112th Place
- 5058 E 112th Place
- 5018 E 112th Place
- 4933 E 111th Place
- 5066 E 112th Place
- 11191 Forest Ave
- 11194 Forest Ave
- 5074 E 112th Place
- 4813 E 111th Place
- 11122 Dahlia Way
- 4803 E 111th Place