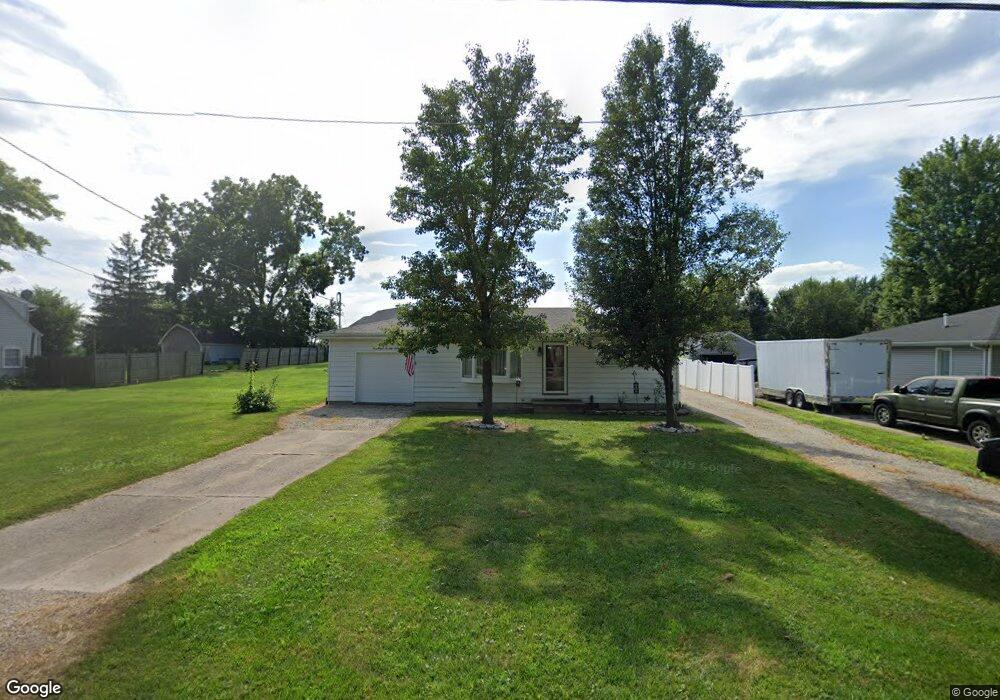
4873 Maud Hughes Rd Liberty Township, OH 45044
Estimated Value: $148,998 - $213,000
2
Beds
1
Bath
825
Sq Ft
$218/Sq Ft
Est. Value
About This Home
This home is located at 4873 Maud Hughes Rd, Liberty Township, OH 45044 and is currently estimated at $180,000, approximately $218 per square foot. 4873 Maud Hughes Rd is a home located in Butler County with nearby schools including VanGorden Elementary School, Liberty Junior School, and Lakota East High School.
Ownership History
Date
Name
Owned For
Owner Type
Purchase Details
Closed on
Nov 22, 2022
Sold by
Halcomb Leah C
Bought by
Cook James M
Current Estimated Value
Home Financials for this Owner
Home Financials are based on the most recent Mortgage that was taken out on this home.
Original Mortgage
$109,900
Outstanding Balance
$104,498
Interest Rate
4.5%
Mortgage Type
New Conventional
Estimated Equity
$75,502
Purchase Details
Closed on
Apr 7, 2022
Sold by
Means Guy S and Means Mary
Bought by
Halcomb Leah C and Halcomb Wilburn L
Purchase Details
Closed on
Jun 5, 2017
Sold by
Halcomb Edward R
Bought by
Linda K Halcomb
Purchase Details
Closed on
Jan 14, 2015
Sold by
Halcomb Linda K and Means Linda K
Bought by
Halcomb Edward R and Halcomb Linda K
Create a Home Valuation Report for This Property
The Home Valuation Report is an in-depth analysis detailing your home's value as well as a comparison with similar homes in the area
Home Values in the Area
Average Home Value in this Area
Purchase History
| Date | Buyer | Sale Price | Title Company |
|---|---|---|---|
| Cook James M | $78,500 | -- | |
| Cook James M | $78,500 | None Listed On Document | |
| Cook James M | $78,500 | None Listed On Document | |
| Cook James M | $78,500 | None Listed On Document | |
| Halcomb Leah C | -- | Davis Michael J | |
| Linda K Halcomb | -- | -- | |
| Halcomb Edward R | -- | None Available | |
| Halcomb Edward R | -- | None Available |
Source: Public Records
Mortgage History
| Date | Status | Borrower | Loan Amount |
|---|---|---|---|
| Open | Cook James M | $109,900 | |
| Closed | Cook James M | $109,900 |
Source: Public Records
Tax History Compared to Growth
Tax History
| Year | Tax Paid | Tax Assessment Tax Assessment Total Assessment is a certain percentage of the fair market value that is determined by local assessors to be the total taxable value of land and additions on the property. | Land | Improvement |
|---|---|---|---|---|
| 2024 | $1,897 | $48,410 | $11,400 | $37,010 |
| 2023 | $1,873 | $48,410 | $11,400 | $37,010 |
| 2022 | $1,640 | $32,200 | $11,400 | $20,800 |
| 2021 | $1,158 | $32,200 | $11,400 | $20,800 |
| 2020 | $1,188 | $32,200 | $11,400 | $20,800 |
| 2019 | $2,689 | $27,910 | $11,400 | $16,510 |
| 2018 | $1,085 | $27,910 | $11,400 | $16,510 |
| 2017 | $1,106 | $27,910 | $11,400 | $16,510 |
| 2016 | $987 | $25,730 | $11,400 | $14,330 |
| 2015 | $991 | $25,730 | $11,400 | $14,330 |
| 2014 | $1,055 | $25,730 | $11,400 | $14,330 |
| 2013 | $1,055 | $26,260 | $10,450 | $15,810 |
Source: Public Records
Map
Nearby Homes
- 4873 Mauds Hughes Rd
- 5051 Cavendish Dr
- 5798 Roden Park Dr
- 5905 Brunswick Ct
- 203 Shyla Ct
- 925 Morgan Dr
- STRATTON Plan at Estates of Monroe Crossings
- VALE Plan at Estates of Monroe Crossings
- VANDERBURGH Plan at Estates of Monroe Crossings
- PARKETTE Plan at Estates of Monroe Crossings
- LYNDHURST Plan at Estates of Monroe Crossings
- BUCHANAN Plan at Estates of Monroe Crossings
- SHELBURN Plan at Estates of Monroe Crossings
- ALDEN Plan at Estates of Monroe Crossings
- BENNETT Plan at Estates of Monroe Crossings
- QUENTIN Plan at Estates of Monroe Crossings
- 511 Shawn Dr
- 390 David Lee Ct
- 2064 Bridgewater Ln
- 389 David Lee Ct
- 4885 Maud Hughes Rd
- 4861 Mauds Hughes Rd
- 4861 Maud Hughes Rd
- 6154 Dawson Dr
- 6153 Dawson Dr
- 6172 Royal Garden Ct
- 6144 Dawson Dr
- 6144 Dawson Dr
- 6162 Royal Garden Ct
- 6152 Royal Garden Ct
- 6143 Dawson Dr
- 4862 Maud Hughes Rd
- 4892 Mauds Hughes Rd
- 6171 Royal Garden Ct
- 6134 Dawson Dr
- 6151 Royal Garden Ct
- 6142 Royal Garden Ct
- 6133 Dawson Dr
- 6161 Royal Garden Ct
- 6132 Royal Garden Ct