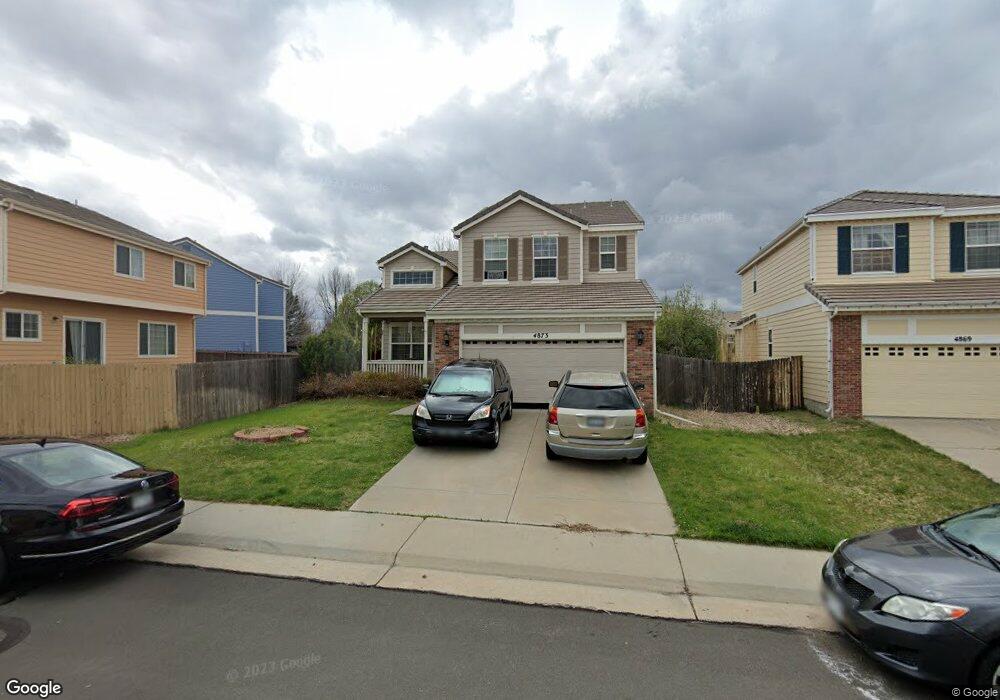
4873 S Kirk Way Aurora, CO 80015
Willow Trace NeighborhoodEstimated Value: $583,634 - $647,000
5
Beds
3
Baths
2,548
Sq Ft
$239/Sq Ft
Est. Value
About This Home
This home is located at 4873 S Kirk Way, Aurora, CO 80015 and is currently estimated at $610,159, approximately $239 per square foot. 4873 S Kirk Way is a home located in Arapahoe County with nearby schools including Aspen Crossing Elementary School, Sky Vista Middle School, and Eaglecrest High School.
Ownership History
Date
Name
Owned For
Owner Type
Purchase Details
Closed on
May 13, 2011
Sold by
Cash Sayuri
Bought by
Cash Jesse D
Current Estimated Value
Purchase Details
Closed on
Oct 14, 2008
Sold by
Williams Valanette D
Bought by
Cash Jesse D and Cash Sayuri M
Home Financials for this Owner
Home Financials are based on the most recent Mortgage that was taken out on this home.
Original Mortgage
$260,482
Outstanding Balance
$172,548
Interest Rate
6.35%
Mortgage Type
VA
Estimated Equity
$437,611
Purchase Details
Closed on
Oct 25, 2002
Sold by
Richmond American Homes Of Colorado Inc
Bought by
Williams Valanette D
Home Financials for this Owner
Home Financials are based on the most recent Mortgage that was taken out on this home.
Original Mortgage
$198,047
Interest Rate
6.25%
Create a Home Valuation Report for This Property
The Home Valuation Report is an in-depth analysis detailing your home's value as well as a comparison with similar homes in the area
Home Values in the Area
Average Home Value in this Area
Purchase History
| Date | Buyer | Sale Price | Title Company |
|---|---|---|---|
| Cash Jesse D | -- | None Available | |
| Cash Jesse D | $255,000 | Multiple | |
| Williams Valanette D | $247,559 | -- |
Source: Public Records
Mortgage History
| Date | Status | Borrower | Loan Amount |
|---|---|---|---|
| Open | Cash Jesse D | $260,482 | |
| Previous Owner | Williams Valanette D | $198,047 |
Source: Public Records
Tax History Compared to Growth
Tax History
| Year | Tax Paid | Tax Assessment Tax Assessment Total Assessment is a certain percentage of the fair market value that is determined by local assessors to be the total taxable value of land and additions on the property. | Land | Improvement |
|---|---|---|---|---|
| 2024 | $4,552 | $36,415 | -- | -- |
| 2023 | $4,552 | $36,415 | $0 | $0 |
| 2022 | $3,951 | $29,614 | $0 | $0 |
| 2021 | $3,992 | $29,614 | $0 | $0 |
| 2020 | $3,803 | $27,964 | $0 | $0 |
| 2019 | $3,730 | $27,964 | $0 | $0 |
| 2018 | $3,687 | $25,546 | $0 | $0 |
| 2017 | $3,642 | $25,546 | $0 | $0 |
| 2016 | $3,194 | $21,508 | $0 | $0 |
| 2015 | $3,112 | $21,508 | $0 | $0 |
| 2014 | $3,030 | $18,411 | $0 | $0 |
| 2013 | -- | $20,260 | $0 | $0 |
Source: Public Records
Map
Nearby Homes
- 20473 E Layton Ave
- 20412 E Chenango Place
- 20431 E Union Cir
- 20551 E Union Ave
- 20785 E Bellewood Place
- 21408 E Union Place
- 4656 S Malaya Ct
- 4683 S Nepal Way
- 20063 E Tufts Dr
- 5200 S Jebel St
- 4839 S Picadilly Ct
- 4861 S Picadilly Ct
- 4862 S Picadilly Ct
- 4822 S Genoa St
- 4483 S Himalaya Cir
- 19905 E Stanford Dr
- 19815 E Belleview Place
- 20478 E Radcliff Ave
- 21893 E Layton Dr
- 21355 E Prentice Ln
- 4869 S Kirk Way
- 4885 S Kirk Ct
- 4891 S Kirk Ct
- 4863 S Kirk Way
- 20579 E Saratoga Place
- 20599 E Saratoga Place
- 4874 S Kirk Way
- 4859 S Kirk Way
- 4870 S Kirk Way
- 4880 S Kirk Way
- 4875 S Jericho Ct
- 4895 S Kirk Ct
- 20569 E Saratoga Place
- 4860 S Kirk Way
- 4849 S Kirk Way
- 4884 S Kirk Way
- 4866 S Jericho Ct
- 20580 E Saratoga Place
- 4850 S Kirk Way
- 20559 E Saratoga Place