
Seller's Agent in 2025
Phil Ryan
Ryan & Sons REALTORS
(785) 564-0295
63 Total Sales
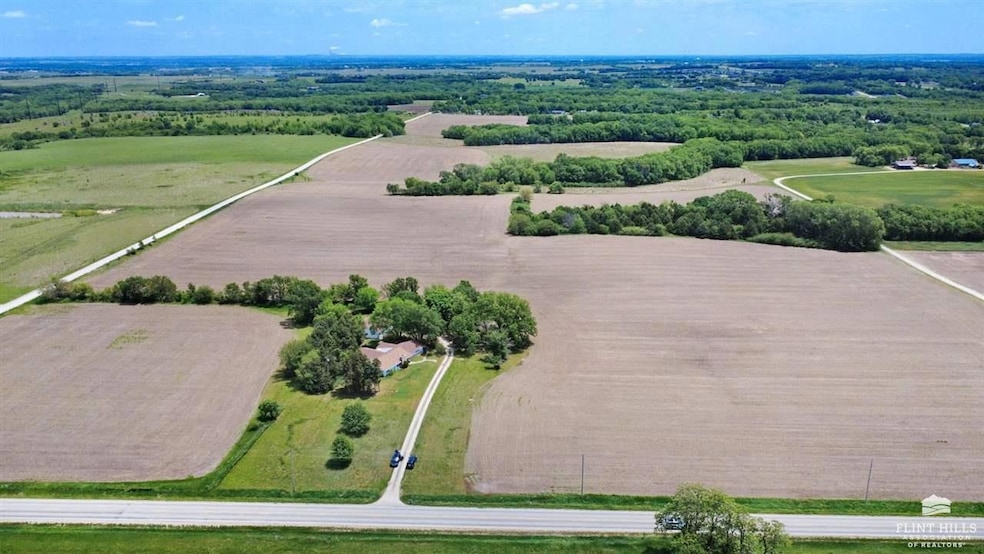


Don't miss this incredible investment opportunity situated just minutes from Manhattan, St. George and Wamego in Pottawatomie County. This 115-acre tract is only 1.6 miles north of Highway 24 on Flush Rd. and has been a family farm for decades but has potential to be the ideal development site. Land tenant shares that they farm approximately 66-acres and current crop is corn with plan to harvest in Septermber-October.
| Date | Type | Sale Price | Title Company |
|---|---|---|---|
| Deed | -- | None Listed On Document | |
| Deed | -- | None Listed On Document | |
| Deed | -- | None Listed On Document | |
| Warranty Deed | -- | None Available |
| Date | Event | Price | List to Sale | Price per Sq Ft |
|---|---|---|---|---|
| 10/15/2025 10/15/25 | Sold | -- | -- | -- |
| 09/18/2025 09/18/25 | Pending | -- | -- | -- |
| 06/16/2025 06/16/25 | For Sale | $2,100,000 | -- | $802 / Sq Ft |
| Year | Tax Paid | Tax Assessment Tax Assessment Total Assessment is a certain percentage of the fair market value that is determined by local assessors to be the total taxable value of land and additions on the property. | Land | Improvement |
|---|---|---|---|---|
| 2025 | $3,136 | $31,407 | $14,165 | $17,242 |
| 2024 | $31 | $34,003 | $17,460 | $16,543 |
| 2023 | $3,403 | $35,112 | $20,043 | $15,069 |
| 2022 | $3,100 | $34,013 | $21,182 | $12,831 |
| 2021 | $3,100 | $32,419 | $20,598 | $11,821 |
| 2020 | $3,100 | $31,657 | $19,810 | $11,847 |
| 2019 | $3,031 | $30,574 | $18,739 | $11,835 |
| 2018 | $2,952 | $28,922 | $16,788 | $12,134 |
| 2017 | $2,360 | $26,276 | $14,503 | $11,773 |
| 2016 | $2,077 | $24,010 | $12,132 | $11,878 |
| 2015 | -- | $22,382 | $10,329 | $12,053 |
| 2014 | -- | $20,968 | $8,000 | $12,968 |
Seller's Agent in 2025
Phil Ryan
Ryan & Sons REALTORS
(785) 564-0295
63 Total Sales
Source: Flint Hills Association of REALTORS®
MLS Number: FHR20251605
APN: 239-32-0-00-00-006.00-0
Disclaimer: Certain information contained herein is derived from information provided by parties other than Homes.com. All information provided is deemed reliable, but is not guaranteed to be accurate and should be independently verified.
![]() IDX information is provided exclusively for consumers' personal, non-commercial use and may not be used for any purpose other than to identify prospective properties consumers may be interested in purchasing.
IDX information is provided exclusively for consumers' personal, non-commercial use and may not be used for any purpose other than to identify prospective properties consumers may be interested in purchasing.
Listing information is deemed reliable, but not guaranteed.
Ask me questions while you tour the home.