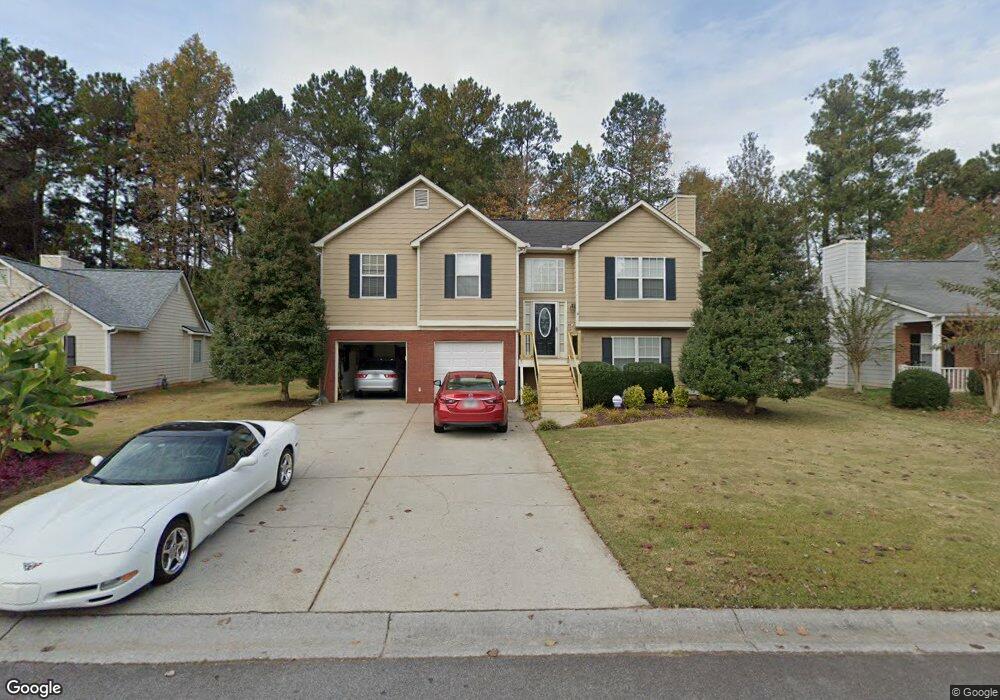
4875 Noah Ridge Unit 3 Acworth, GA 30101
Estimated Value: $331,529 - $367,000
3
Beds
2
Baths
1,440
Sq Ft
$240/Sq Ft
Est. Value
About This Home
This home is located at 4875 Noah Ridge Unit 3, Acworth, GA 30101 and is currently estimated at $345,132, approximately $239 per square foot. 4875 Noah Ridge Unit 3 is a home located in Cobb County with nearby schools including McCall Primary School, Acworth Intermediate School, and Barber Middle School.
Ownership History
Date
Name
Owned For
Owner Type
Purchase Details
Closed on
Dec 28, 2001
Sold by
Price Craig E and Price Lauren N
Bought by
Knight Handley E and Knight Kimberly M
Current Estimated Value
Home Financials for this Owner
Home Financials are based on the most recent Mortgage that was taken out on this home.
Original Mortgage
$151,725
Outstanding Balance
$66,919
Interest Rate
6.99%
Mortgage Type
New Conventional
Estimated Equity
$278,213
Purchase Details
Closed on
Sep 18, 2000
Sold by
Blanco Katherine L
Bought by
Price Craig E and Price Lauren N
Home Financials for this Owner
Home Financials are based on the most recent Mortgage that was taken out on this home.
Original Mortgage
$108,000
Interest Rate
8.05%
Mortgage Type
New Conventional
Purchase Details
Closed on
Apr 29, 1997
Sold by
Four Star Properties Inc
Bought by
Blanco Katherine L
Home Financials for this Owner
Home Financials are based on the most recent Mortgage that was taken out on this home.
Original Mortgage
$97,784
Interest Rate
7.95%
Mortgage Type
New Conventional
Create a Home Valuation Report for This Property
The Home Valuation Report is an in-depth analysis detailing your home's value as well as a comparison with similar homes in the area
Home Values in the Area
Average Home Value in this Area
Purchase History
| Date | Buyer | Sale Price | Title Company |
|---|---|---|---|
| Knight Handley E | $148,800 | -- | |
| Price Craig E | $135,000 | -- | |
| Blanco Katherine L | $115,100 | -- |
Source: Public Records
Mortgage History
| Date | Status | Borrower | Loan Amount |
|---|---|---|---|
| Open | Knight Handley E | $151,725 | |
| Previous Owner | Price Craig E | $108,000 | |
| Previous Owner | Blanco Katherine L | $97,784 |
Source: Public Records
Tax History Compared to Growth
Tax History
| Year | Tax Paid | Tax Assessment Tax Assessment Total Assessment is a certain percentage of the fair market value that is determined by local assessors to be the total taxable value of land and additions on the property. | Land | Improvement |
|---|---|---|---|---|
| 2025 | $714 | $146,316 | $32,000 | $114,316 |
| 2024 | $717 | $146,316 | $32,000 | $114,316 |
| 2023 | $446 | $124,760 | $21,600 | $103,160 |
| 2022 | $2,475 | $108,960 | $21,600 | $87,360 |
| 2021 | $2,083 | $91,028 | $21,600 | $69,428 |
| 2020 | $2,292 | $81,912 | $21,600 | $60,312 |
| 2019 | $1,641 | $70,844 | $21,600 | $49,244 |
| 2018 | $1,641 | $70,844 | $21,600 | $49,244 |
| 2017 | $1,377 | $61,080 | $12,800 | $48,280 |
| 2016 | $1,230 | $54,284 | $12,000 | $42,284 |
| 2015 | $1,259 | $54,284 | $12,000 | $42,284 |
| 2014 | $1,111 | $47,284 | $0 | $0 |
Source: Public Records
Map
Nearby Homes
- 3157 Parfait Place Unit 2
- 3032 Lake Park Trail
- 4821 Batiste Ln
- 4817 Batiste Ln
- 4819 Batiste Ln
- 3022 Estuary Ridge
- 3157 Peartree Dr NW
- 4908 Carson Glen Ln
- 164 Windcroft Cir NW
- 5021 Kathryn Glen Dr NW
- 5052 Kathryn Glen Dr Unit 60
- 4851 Lake Park Ln
- 1093 Athena Ct
- 2617 Lake Park Bend
- 286 Windcroft Cir NW
- 159 Windcroft Ln NW Unit 3C
- 4518 Columbus Cir
- 4561 Grenadine Cir
- 3317 Grove Park Terrace NW Unit 1
- 4591 Grenadine Cir
- 4873 Noah Ridge
- 4877 Noah Ridge
- 0 Noah Ridge Unit 8128765
- 0 Noah Ridge
- 4763 Baker Plantation Dr
- 3152 Parfait Place
- 4871 Noah Ridge
- 4879 Noah Ridge
- 3154 Parfait Place Unit 2
- 4874 Noah Ridge
- 4765 Baker Plantation Dr
- 4876 Noah Ridge
- 4872 Noah Ridge
- 4881 Noah Ridge Unit 3
- 3150 Parfait Place
- 3156 Parfait Place Unit 2
- 4878 Noah Ridge
- 4762 Baker Plantation Dr Unit 2
- 4762 Baker Plantation Dr
- 4762 Baker Plantation Dr Unit 116