Estimated Value: $375,000 - $417,000
3
Beds
1
Bath
916
Sq Ft
$426/Sq Ft
Est. Value
About This Home
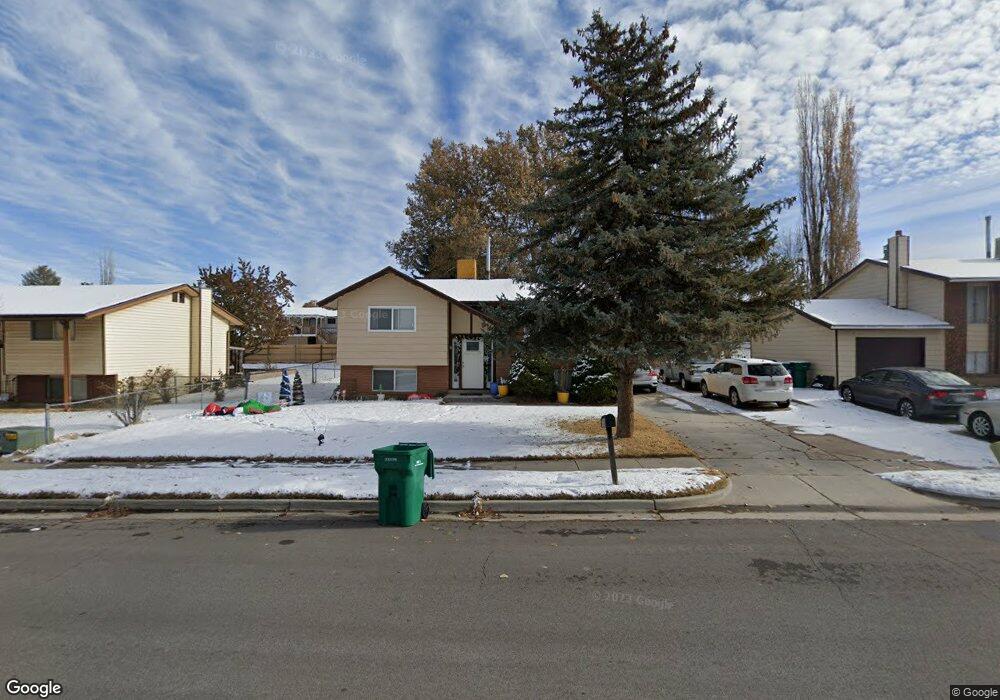
This home is located at 4876 S 2875 W, Roy, UT 84067 and is currently estimated at $390,653, approximately $426 per square foot. 4876 S 2875 W is a home located in Weber County with nearby schools including Midland School, Sand Ridge Junior High School, and Roy High School.
Ownership History
Date
Name
Owned For
Owner Type
Purchase Details
Closed on
Oct 4, 2017
Sold by
Winn Don A and Winn Joan
Bought by
Lukens Daniel
Current Estimated Value
Home Financials for this Owner
Home Financials are based on the most recent Mortgage that was taken out on this home.
Original Mortgage
$124,000
Outstanding Balance
$103,686
Interest Rate
3.86%
Mortgage Type
Purchase Money Mortgage
Estimated Equity
$286,967
Purchase Details
Closed on
Oct 3, 2017
Sold by
Winn Don A and Winn Joan
Bought by
Lukens Daniel
Home Financials for this Owner
Home Financials are based on the most recent Mortgage that was taken out on this home.
Original Mortgage
$124,000
Outstanding Balance
$103,686
Interest Rate
3.86%
Mortgage Type
Purchase Money Mortgage
Estimated Equity
$286,967
Purchase Details
Closed on
Feb 3, 1998
Sold by
Burrell Kevin and Burrell Bonnie M
Bought by
Winn Don A and Winn Joan
Create a Home Valuation Report for This Property
The Home Valuation Report is an in-depth analysis detailing your home's value as well as a comparison with similar homes in the area
Home Values in the Area
Average Home Value in this Area
Purchase History
| Date | Buyer | Sale Price | Title Company |
|---|---|---|---|
| Lukens Daniel | -- | Meridian Title Co | |
| Lukens Daniel | -- | Meridian Title Co | |
| Winn Don A | -- | -- |
Source: Public Records
Mortgage History
| Date | Status | Borrower | Loan Amount |
|---|---|---|---|
| Open | Lukens Daniel | $124,000 | |
| Closed | Lukens Daniel | $124,000 |
Source: Public Records
Tax History Compared to Growth
Tax History
| Year | Tax Paid | Tax Assessment Tax Assessment Total Assessment is a certain percentage of the fair market value that is determined by local assessors to be the total taxable value of land and additions on the property. | Land | Improvement |
|---|---|---|---|---|
| 2025 | $2,212 | $343,363 | $130,015 | $213,348 |
| 2024 | $2,127 | $182,599 | $71,508 | $111,091 |
| 2023 | $2,020 | $173,250 | $65,864 | $107,386 |
| 2022 | $2,230 | $199,650 | $55,008 | $144,642 |
| 2021 | $1,786 | $261,000 | $75,002 | $185,998 |
| 2020 | $1,610 | $215,000 | $75,002 | $139,998 |
| 2019 | $1,512 | $189,000 | $44,989 | $144,011 |
| 2018 | $1,381 | $161,000 | $44,989 | $116,011 |
| 2017 | $1,297 | $141,000 | $44,989 | $96,011 |
| 2016 | $1,258 | $73,460 | $21,944 | $51,516 |
| 2015 | $1,136 | $67,302 | $21,944 | $45,358 |
| 2014 | $1,144 | $67,181 | $21,944 | $45,237 |
Source: Public Records
Map
Nearby Homes