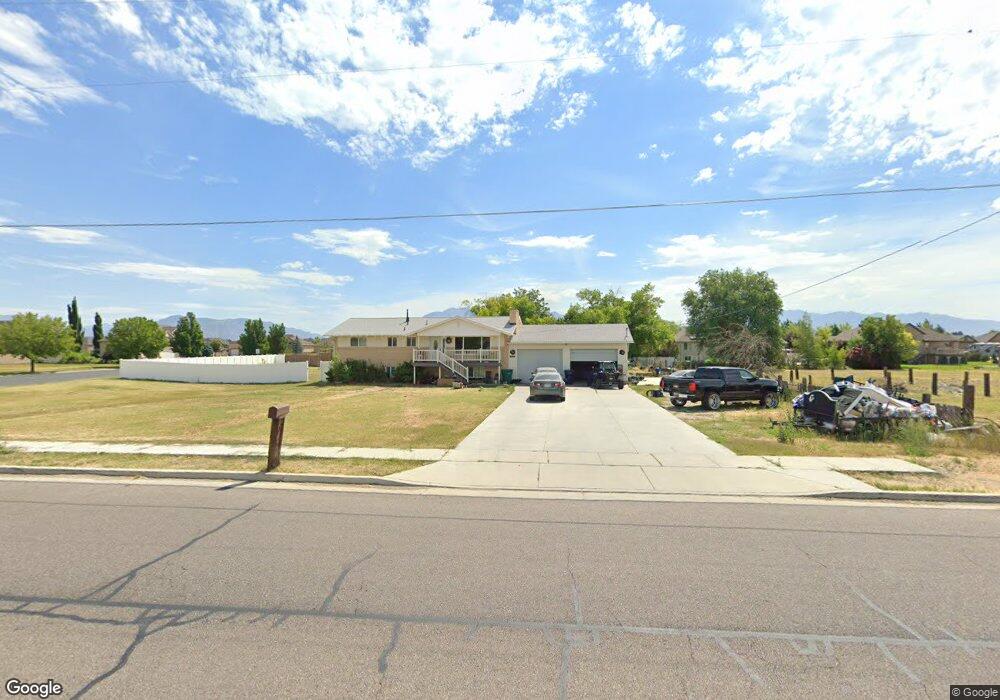
4876 S 5100 W Hooper, UT 84315
Estimated Value: $543,000 - $672,000
4
Beds
2
Baths
2,592
Sq Ft
$225/Sq Ft
Est. Value
About This Home
This home is located at 4876 S 5100 W, Hooper, UT 84315 and is currently estimated at $582,865, approximately $224 per square foot. 4876 S 5100 W is a home located in Weber County with nearby schools including Hooper Elementary School, Rocky Mountain Junior High School, and Fremont High School.
Ownership History
Date
Name
Owned For
Owner Type
Purchase Details
Closed on
Apr 5, 2021
Sold by
Solomon Aaron and Solomon Debbie L
Bought by
Morales Maribel and Morales Jose A
Current Estimated Value
Home Financials for this Owner
Home Financials are based on the most recent Mortgage that was taken out on this home.
Original Mortgage
$222,300
Outstanding Balance
$200,059
Interest Rate
2.8%
Mortgage Type
New Conventional
Estimated Equity
$382,806
Purchase Details
Closed on
Jun 16, 2014
Sold by
Solomon Aaron
Bought by
Solomon Aaron and Solomon Debbie L
Purchase Details
Closed on
Jun 13, 2014
Sold by
Durney Cory and Durney Rikki
Bought by
Solomon Aaron
Purchase Details
Closed on
Sep 30, 2005
Sold by
Frew Justin L and Frew Lori A
Bought by
Durney Cory and Durney Rikki
Create a Home Valuation Report for This Property
The Home Valuation Report is an in-depth analysis detailing your home's value as well as a comparison with similar homes in the area
Home Values in the Area
Average Home Value in this Area
Purchase History
| Date | Buyer | Sale Price | Title Company |
|---|---|---|---|
| Morales Maribel | -- | Utah Mountain Title | |
| Solomon Aaron | -- | Bonneville Superior Title Co | |
| Solomon Aaron | -- | Bonneville Superior Title Co | |
| Durney Cory | -- | First American Title |
Source: Public Records
Mortgage History
| Date | Status | Borrower | Loan Amount |
|---|---|---|---|
| Open | Morales Maribel | $222,300 |
Source: Public Records
Tax History Compared to Growth
Tax History
| Year | Tax Paid | Tax Assessment Tax Assessment Total Assessment is a certain percentage of the fair market value that is determined by local assessors to be the total taxable value of land and additions on the property. | Land | Improvement |
|---|---|---|---|---|
| 2025 | $2,663 | $464,372 | $176,927 | $287,445 |
| 2024 | $2,568 | $456,000 | $176,927 | $279,073 |
| 2023 | $2,688 | $473,000 | $219,785 | $253,215 |
| 2022 | $2,833 | $510,000 | $174,656 | $335,344 |
| 2021 | $2,301 | $384,000 | $105,362 | $278,638 |
| 2020 | $2,087 | $319,000 | $85,058 | $233,942 |
| 2019 | $2,055 | $297,000 | $60,261 | $236,739 |
| 2018 | $1,852 | $256,000 | $60,261 | $195,739 |
| 2017 | $1,531 | $205,000 | $61,079 | $143,921 |
| 2016 | $1,356 | $97,990 | $23,953 | $74,037 |
| 2015 | $1,326 | $94,464 | $23,953 | $70,511 |
| 2014 | $1,301 | $90,177 | $28,325 | $61,852 |
Source: Public Records
Map
Nearby Homes
- 4879 S 5050 W
- 4931 S 4700 W
- 4556 W 4950 S
- 3191 S 5100 St W Unit 1
- 3729 S 5600 W Unit 6
- 3720 S 5600 W Unit 2
- 3719 S 5600 W Unit 7
- 4700 W 5500 S
- 5335 W 5500 S
- 4126 S 4950 W
- 4449 W 5325 S
- 4756 S 4300 W
- 5116 S 4300 W
- 5947 W 4600 S
- 4337 W 5430 S Unit A
- 4111 S 5350 W
- 5160 W 5725 S
- 4712 W 4100 S
- 5013 S 4150 W
- 4218 W 5050 S
- 4835 S 5050 W
- 4857 S 5050 W
- 4851 S 5100 W Unit 1
- 4843 S 5100 W
- 5066 W 4825 S
- 4901 S 5050 W
- 4877 S 5100 W Unit 2
- 4877 S 5100 W
- 4858 S 5050 W
- 4836 S 5050 W
- 4880 S 5050 W
- 4757 S 5050 W
- 5135 W 4825 S
- 4933 S 5050 W
- 4933 S 5050 W Unit 120
- 4822 S 5050 W
- 4795 S 5100 W
- 4891 S 5100 W
- 4811 S 5100 W
- 4811 S 5100 W Unit 1