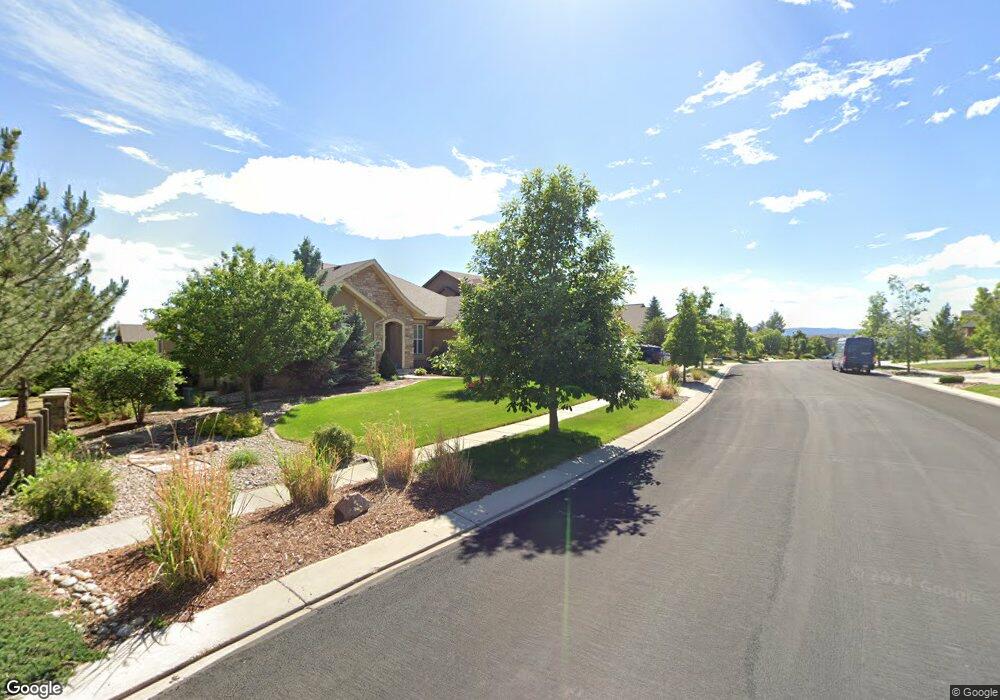
4877 Alberta Falls Way Colorado Springs, CO 80924
Wolf Ranch NeighborhoodEstimated Value: $848,000 - $992,000
6
Beds
4
Baths
2,571
Sq Ft
$355/Sq Ft
Est. Value
About This Home
This home is located at 4877 Alberta Falls Way, Colorado Springs, CO 80924 and is currently estimated at $913,173, approximately $355 per square foot. 4877 Alberta Falls Way is a home located in El Paso County with nearby schools including Chinook Trail Elementary School, Challenger Middle School, and Pine Creek High School.
Ownership History
Date
Name
Owned For
Owner Type
Purchase Details
Closed on
Nov 30, 2021
Sold by
Bond David W and Bond Christie A
Bought by
The Abcd Trust
Current Estimated Value
Purchase Details
Closed on
Nov 28, 2011
Sold by
Bond David W and Bond Christie A
Bought by
Bond David W and Bond Christie A
Home Financials for this Owner
Home Financials are based on the most recent Mortgage that was taken out on this home.
Original Mortgage
$405,500
Interest Rate
4.02%
Mortgage Type
New Conventional
Purchase Details
Closed on
Sep 17, 2008
Sold by
Keller Homes Inc
Bought by
Bond David W and Bond Christie A
Home Financials for this Owner
Home Financials are based on the most recent Mortgage that was taken out on this home.
Original Mortgage
$417,000
Interest Rate
6.6%
Mortgage Type
Purchase Money Mortgage
Create a Home Valuation Report for This Property
The Home Valuation Report is an in-depth analysis detailing your home's value as well as a comparison with similar homes in the area
Home Values in the Area
Average Home Value in this Area
Purchase History
| Date | Buyer | Sale Price | Title Company |
|---|---|---|---|
| The Abcd Trust | -- | None Available | |
| Bond David W | -- | Land Title Guarantee Company | |
| Bond David W | $611,873 | Land Title Guarantee Company |
Source: Public Records
Mortgage History
| Date | Status | Borrower | Loan Amount |
|---|---|---|---|
| Previous Owner | Bond David W | $405,500 | |
| Previous Owner | Bond David W | $417,000 |
Source: Public Records
Tax History Compared to Growth
Tax History
| Year | Tax Paid | Tax Assessment Tax Assessment Total Assessment is a certain percentage of the fair market value that is determined by local assessors to be the total taxable value of land and additions on the property. | Land | Improvement |
|---|---|---|---|---|
| 2025 | $3,512 | $65,250 | -- | -- |
| 2024 | $3,522 | $62,110 | $10,450 | $51,660 |
| 2022 | $3,105 | $46,920 | $9,600 | $37,320 |
| 2021 | $3,667 | $48,270 | $9,880 | $38,390 |
| 2020 | $4,206 | $46,930 | $8,590 | $38,340 |
| 2019 | $4,168 | $46,930 | $8,590 | $38,340 |
| 2018 | $4,037 | $44,680 | $8,320 | $36,360 |
| 2017 | $4,026 | $44,680 | $8,320 | $36,360 |
| 2016 | $4,153 | $46,000 | $9,070 | $36,930 |
| 2015 | $4,148 | $46,000 | $9,070 | $36,930 |
| 2014 | $3,884 | $42,980 | $8,660 | $34,320 |
Source: Public Records
Map
Nearby Homes
- 4901 Rainbow Gulch Trail
- 4911 Pearl Lake Way
- The Crestone Plan at Cordera
- The Princeton Plan at Cordera
- The Sterling Plan at Cordera
- The Granby Plan at Cordera
- The Castlewood Plan at Cordera
- The Sopris Plan at Cordera
- The Glenwood Plan at Cordera
- The Dillon Plan at Cordera
- 9912 San Luis Park Ct
- 4932 Sand Canyon Trail
- 5016 Gibson Lake Ct
- 4837 Turquoise Lake Ct
- 4754 Hanging Lake Cir
- 4841 Hanging Lake Cir
- 10137 Emerald Lake Ln
- Steamboat Plan at Cordera - Two Story
- Dillon Plan at Cordera - Ranch
- The Thoreau Plan at Cordera - Signature Series
- 4863 Alberta Falls Way
- 4891 Alberta Falls Way
- 4849 Alberta Falls Way
- 4854 Rainbow Gulch Trail
- 4864 Alberta Falls Way
- 4878 Alberta Falls Way
- 4835 Alberta Falls Way
- 4850 Alberta Falls Way
- 4842 Rainbow Gulch Trail
- 4892 Alberta Falls Way
- 4830 Rainbow Gulch Trail
- 4836 Alberta Falls Way
- 4821 Alberta Falls Way
- 4905 Alberta Falls Way
- 4902 Rainbow Gulch Trail
- 4822 Alberta Falls Way
- 4877 Rainbow Gulch Trail
- 4865 Rainbow Gulch Trail
- 4818 Rainbow Gulch Trail
- 4807 Alberta Falls Way