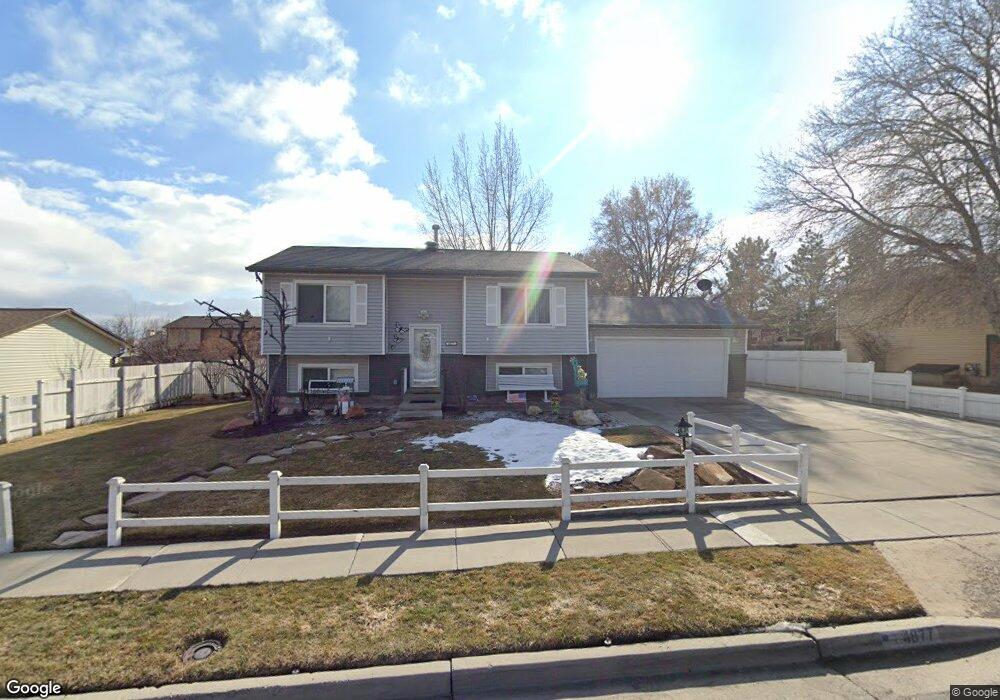
4877 Edinburgh Ln West Jordan, UT 84081
Copper Hills NeighborhoodEstimated Value: $434,000 - $491,000
4
Beds
2
Baths
1,706
Sq Ft
$276/Sq Ft
Est. Value
About This Home
This home is located at 4877 Edinburgh Ln, West Jordan, UT 84081 and is currently estimated at $470,661, approximately $275 per square foot. 4877 Edinburgh Ln is a home located in Salt Lake County with nearby schools including Jordan Hills Elementary School, West Hills Middle School, and Copper Hills High School.
Ownership History
Date
Name
Owned For
Owner Type
Purchase Details
Closed on
Aug 25, 2006
Sold by
Sanchez Jessica Lynn
Bought by
Sanchez George H and Sanchez Madlyn P
Current Estimated Value
Home Financials for this Owner
Home Financials are based on the most recent Mortgage that was taken out on this home.
Original Mortgage
$37,000
Interest Rate
6.33%
Mortgage Type
Stand Alone Second
Purchase Details
Closed on
Jan 4, 2005
Sold by
Alvarado Juan
Bought by
Ramirez Armando Carmona and Sanchez Jessica Lynn
Purchase Details
Closed on
Apr 24, 2002
Sold by
Vandenberg Michael J and Vandenberg Johanna M
Bought by
Ramirez Armando Carmona and Sanchez Jessica Lynn
Home Financials for this Owner
Home Financials are based on the most recent Mortgage that was taken out on this home.
Original Mortgage
$137,738
Interest Rate
7.08%
Mortgage Type
FHA
Create a Home Valuation Report for This Property
The Home Valuation Report is an in-depth analysis detailing your home's value as well as a comparison with similar homes in the area
Home Values in the Area
Average Home Value in this Area
Purchase History
| Date | Buyer | Sale Price | Title Company |
|---|---|---|---|
| Sanchez George H | -- | Surety Title | |
| Sanchez Jessica Lynn | -- | Surety Title | |
| Ramirez Armando Carmona | -- | Mountain View Title | |
| Ramirez Armando Carmona | -- | Title One Inc |
Source: Public Records
Mortgage History
| Date | Status | Borrower | Loan Amount |
|---|---|---|---|
| Closed | Sanchez Jessica Lynn | $37,000 | |
| Open | Sanchez George H | $148,000 | |
| Previous Owner | Ramirez Armando Carmona | $137,738 |
Source: Public Records
Tax History Compared to Growth
Tax History
| Year | Tax Paid | Tax Assessment Tax Assessment Total Assessment is a certain percentage of the fair market value that is determined by local assessors to be the total taxable value of land and additions on the property. | Land | Improvement |
|---|---|---|---|---|
| 2025 | $2,156 | $435,800 | $143,400 | $292,400 |
| 2024 | $2,156 | $414,900 | $136,600 | $278,300 |
| 2023 | $2,200 | $398,900 | $132,600 | $266,300 |
| 2022 | $2,145 | $382,700 | $130,000 | $252,700 |
| 2021 | $1,867 | $303,200 | $105,000 | $198,200 |
| 2020 | $1,749 | $266,600 | $89,000 | $177,600 |
| 2019 | $1,724 | $257,600 | $89,000 | $168,600 |
| 2018 | $1,629 | $241,400 | $86,000 | $155,400 |
| 2017 | $1,383 | $204,100 | $86,000 | $118,100 |
| 2016 | $1,357 | $188,200 | $86,000 | $102,200 |
| 2015 | $1,378 | $186,300 | $87,600 | $98,700 |
| 2014 | $1,387 | $184,600 | $87,600 | $97,000 |
Source: Public Records
Map
Nearby Homes
- 7903 Mckenzie Ln
- 7886 Mckenzie Ln
- 8322 Copper Vista Cir
- 8359 Etude Dr
- 4887 W 8620 S
- 8577 Autumn Gold Cir
- 4678 Emmons Dr
- 7973 S Nebo Dr
- 7908 Cold Stone Ln Unit N3
- 5189 W Dove Creek Ln
- 8453 S Windmill Dr
- 5228 W Ranches Loop Rd
- 5298 W Icehouse Way
- 7882 S Dove Creek Ln Unit A6
- 5422 W Island Creek Dr
- 5262 W Cool Water Way
- 4624 Pine Crossing Dr
- 7877 S 5440 W Unit 119
- 8854 Rocky Creek Dr
- 5098 Cherry Laurel Ln
- 4865 W Edinburgh Ln
- 4865 Edinburgh Ln
- 4891 W Edinburgh Ln
- 4891 Edinburgh Ln
- 4878 Gaskill Way
- 4866 W Gaskill Way
- 4866 Gaskill Way
- 4892 Gaskill Way
- 4853 Edinburgh Ln
- 4853 W Edinburgh Ln
- 4905 W Edinburgh Ln
- 4876 Edinburgh Ln
- 4905 Edinburgh Ln
- 4886 Edinburgh Ln
- 4886 W Edinburgh Ln
- 4864 Edinburgh Ln
- 4864 W Edinburgh Ln
- 4854 Gaskill Way
- 4906 W Gaskill Way
- 4906 Gaskill Way