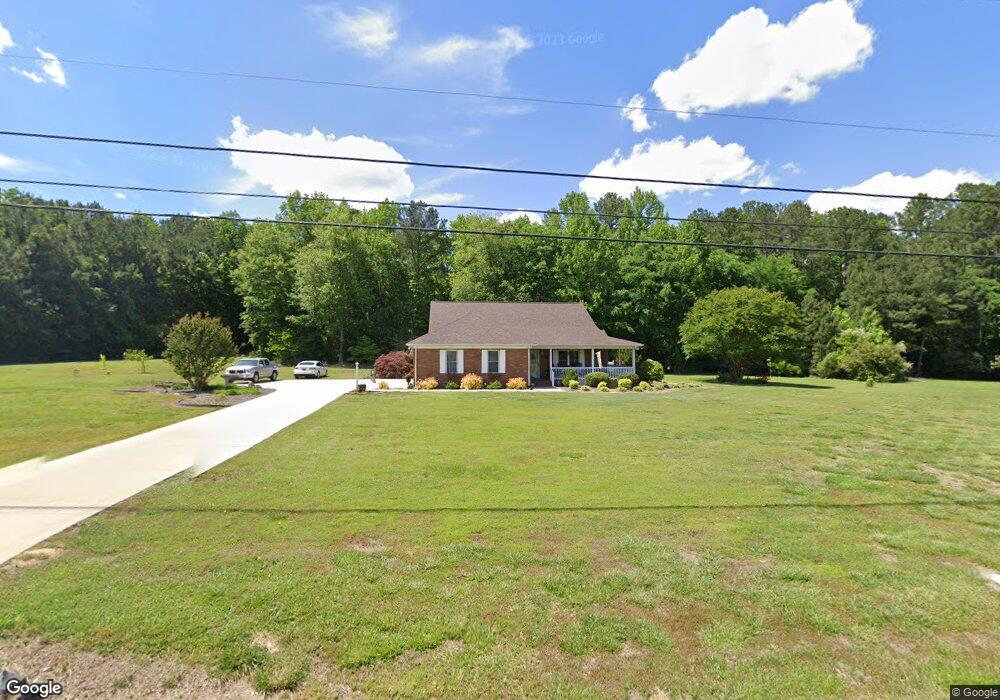
48771 Piney Point Rd Norwood, NC 28128
Estimated Value: $311,000 - $413,000
3
Beds
2
Baths
1,629
Sq Ft
$227/Sq Ft
Est. Value
About This Home
This home is located at 48771 Piney Point Rd, Norwood, NC 28128 and is currently estimated at $369,050, approximately $226 per square foot. 48771 Piney Point Rd is a home located in Stanly County with nearby schools including Norwood Elementary School, South Stanly Middle School, and South Stanly High School.
Ownership History
Date
Name
Owned For
Owner Type
Purchase Details
Closed on
Sep 23, 2008
Sold by
Forth Douglas S and Forth Leeore A
Bought by
Smith Douglas O and Smith Tina D
Current Estimated Value
Home Financials for this Owner
Home Financials are based on the most recent Mortgage that was taken out on this home.
Original Mortgage
$164,000
Outstanding Balance
$108,926
Interest Rate
6.49%
Mortgage Type
Purchase Money Mortgage
Estimated Equity
$260,124
Create a Home Valuation Report for This Property
The Home Valuation Report is an in-depth analysis detailing your home's value as well as a comparison with similar homes in the area
Home Values in the Area
Average Home Value in this Area
Purchase History
| Date | Buyer | Sale Price | Title Company |
|---|---|---|---|
| Smith Douglas O | $205,000 | None Available |
Source: Public Records
Mortgage History
| Date | Status | Borrower | Loan Amount |
|---|---|---|---|
| Open | Smith Douglas O | $164,000 |
Source: Public Records
Tax History Compared to Growth
Tax History
| Year | Tax Paid | Tax Assessment Tax Assessment Total Assessment is a certain percentage of the fair market value that is determined by local assessors to be the total taxable value of land and additions on the property. | Land | Improvement |
|---|---|---|---|---|
| 2025 | $1,697 | $278,217 | $37,510 | $240,707 |
| 2024 | $1,892 | $199,965 | $29,508 | $170,457 |
| 2023 | $1,661 | $199,965 | $29,508 | $170,457 |
| 2022 | $1,517 | $199,965 | $29,508 | $170,457 |
| 2021 | $1,515 | $199,965 | $29,508 | $170,457 |
| 2020 | $1,403 | $172,370 | $26,507 | $145,863 |
| 2019 | $1,412 | $172,370 | $26,507 | $145,863 |
| 2018 | $1,503 | $172,370 | $26,507 | $145,863 |
| 2017 | $1,327 | $172,370 | $26,507 | $145,863 |
| 2016 | $1,295 | $168,212 | $24,506 | $143,706 |
| 2015 | $1,379 | $168,212 | $24,506 | $143,706 |
| 2014 | $1,226 | $168,212 | $24,506 | $143,706 |
Source: Public Records
Map
Nearby Homes
- 9711 Pine Tree Rd
- 9763 Pine Tree Rd
- 10316 Sycamore Rd
- 11133 Willow Oak Rd
- 10994 Willow Oak Rd
- 647 Acorn Acres Rd
- 49412 Wood Land Dr
- 604 Acorn Acres Rd
- 638 Acorn Acres Rd
- 0 Acorn Acres Rd Unit CAR4277296
- 211 Acorn Acres Rd
- 4866 Fork Rd
- 472 Oak Rd Unit 114/115
- 431 Island Cove Rd Unit 86
- 00 Oak Rd
- 451 S Strand Dr
- 366 Lakehurst Farm Rd
- 165 Clearview Point Dr
- 207 Allenton St
- 133 Montview Dr
- 48785 Piney Point Rd
- 49252 Maple St
- 10015 Ash St
- Lot 62 Maple St
- 9624 Pine Tree Rd
- 48731 Piney Point Rd
- 48815 Piney Point Rd
- 48725 Piney Point Rd
- 9644 Pine Tree Rd
- Lot 62 Pine Tree Rd
- 0 Maple St
- 9654 Pine Tree Rd
- 9619 Pine Tree Rd
- 48827 Piney Point Rd
- 9625 Pine Tree Rd
- 9664 Pine Tree Rd
- 9635 Pine Tree Rd
- 9655 Pine Tree Rd
- 48839 Piney Point Rd
- 9682 Pine Tree Rd